Menambahkan gaya
Pengantar Data Science dengan Python

Hillary Green-Lerman
Senior Curriculum Lead, DataCamp
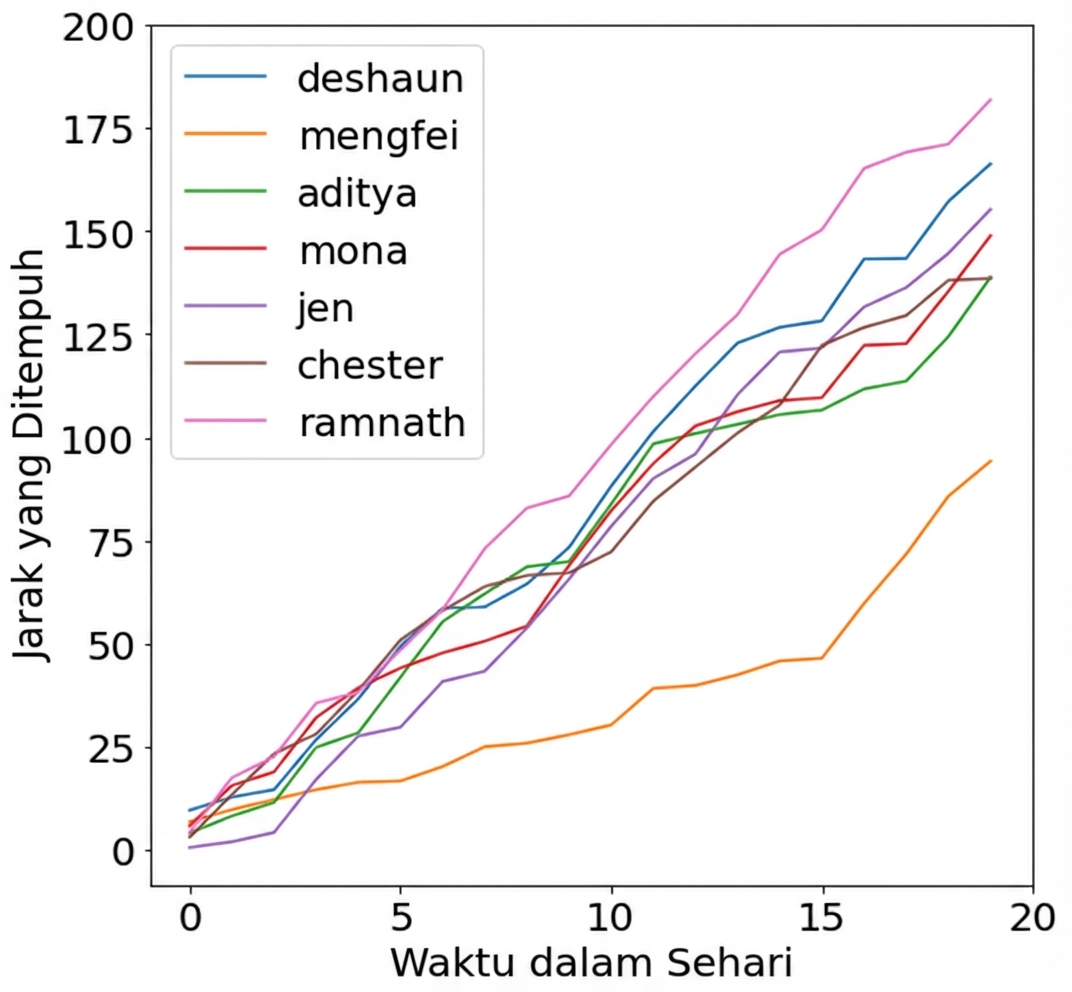
Dan mil yang harus ditempuh

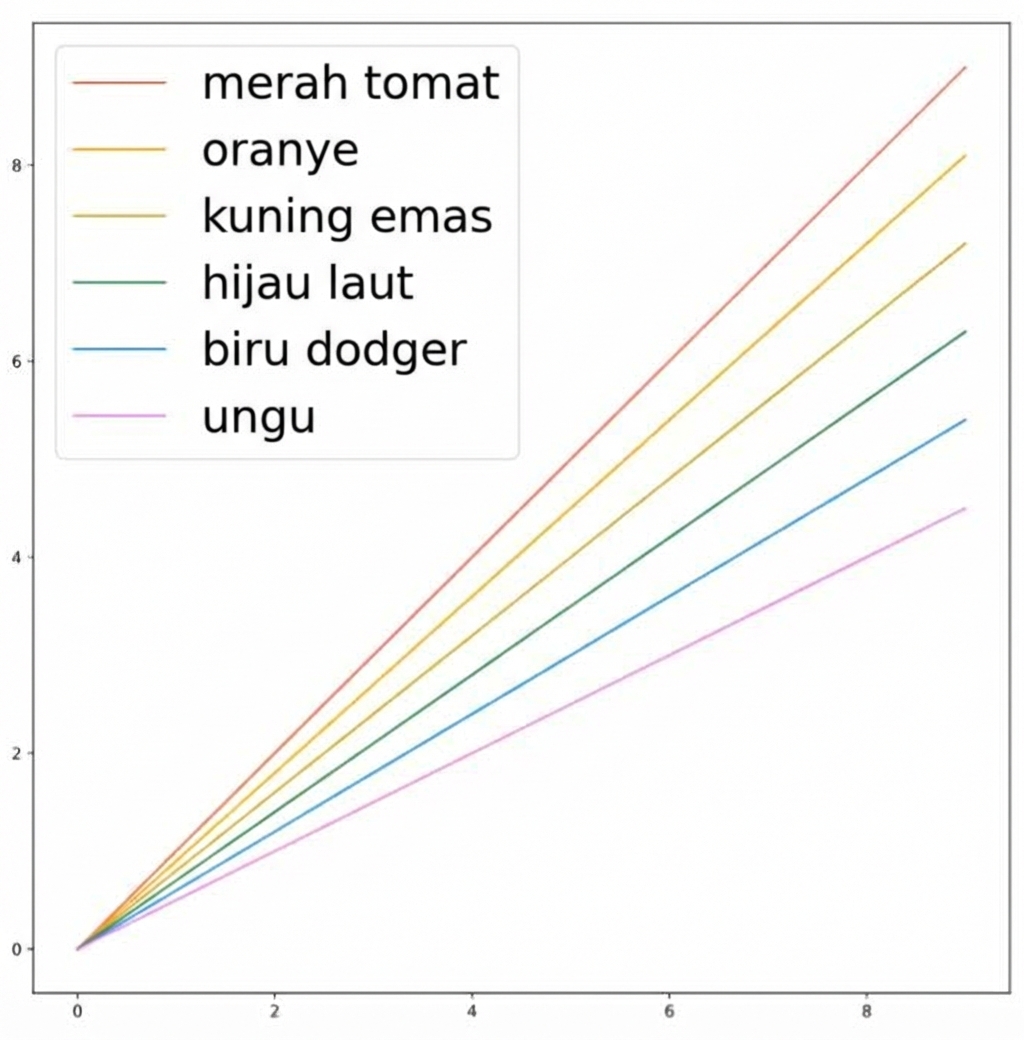
Mengubah warna garis
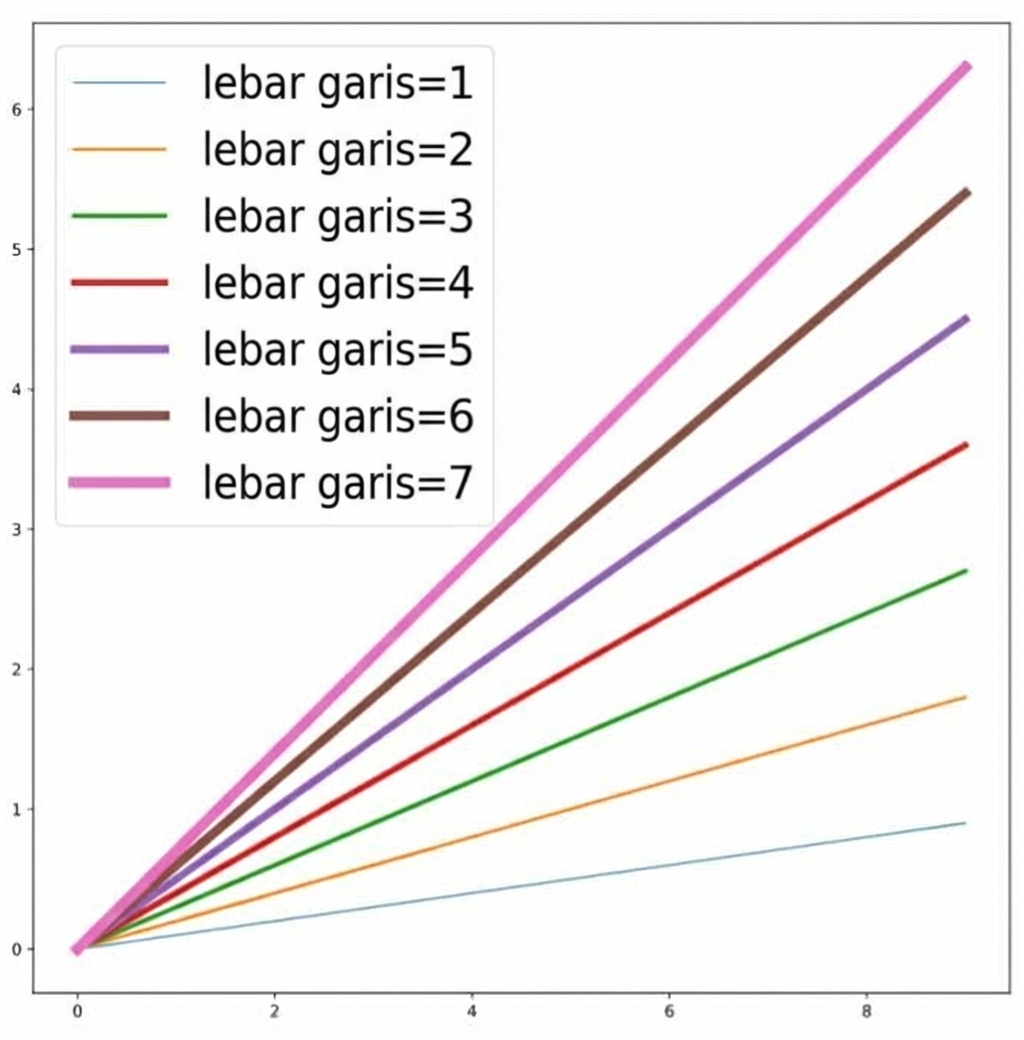
Mengubah ketebalan garis
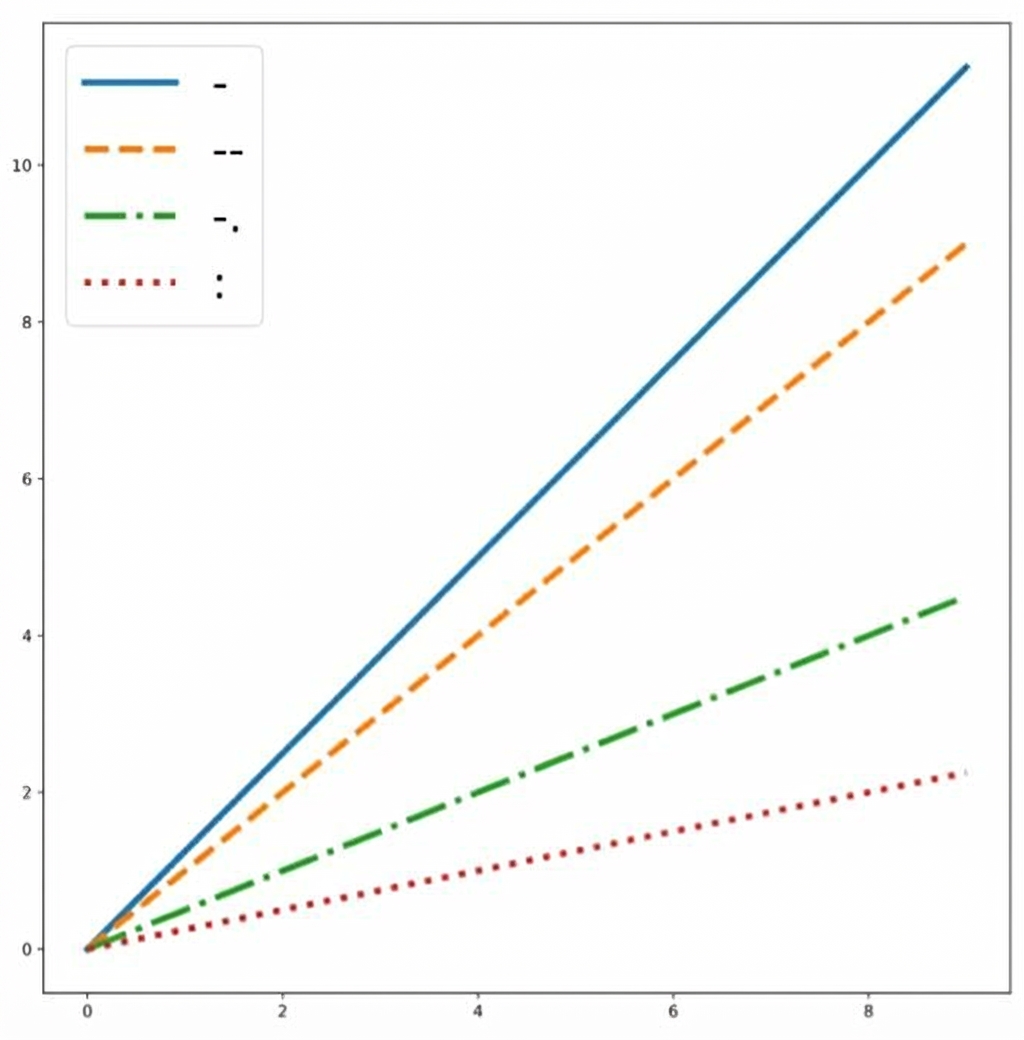
Mengubah gaya garis
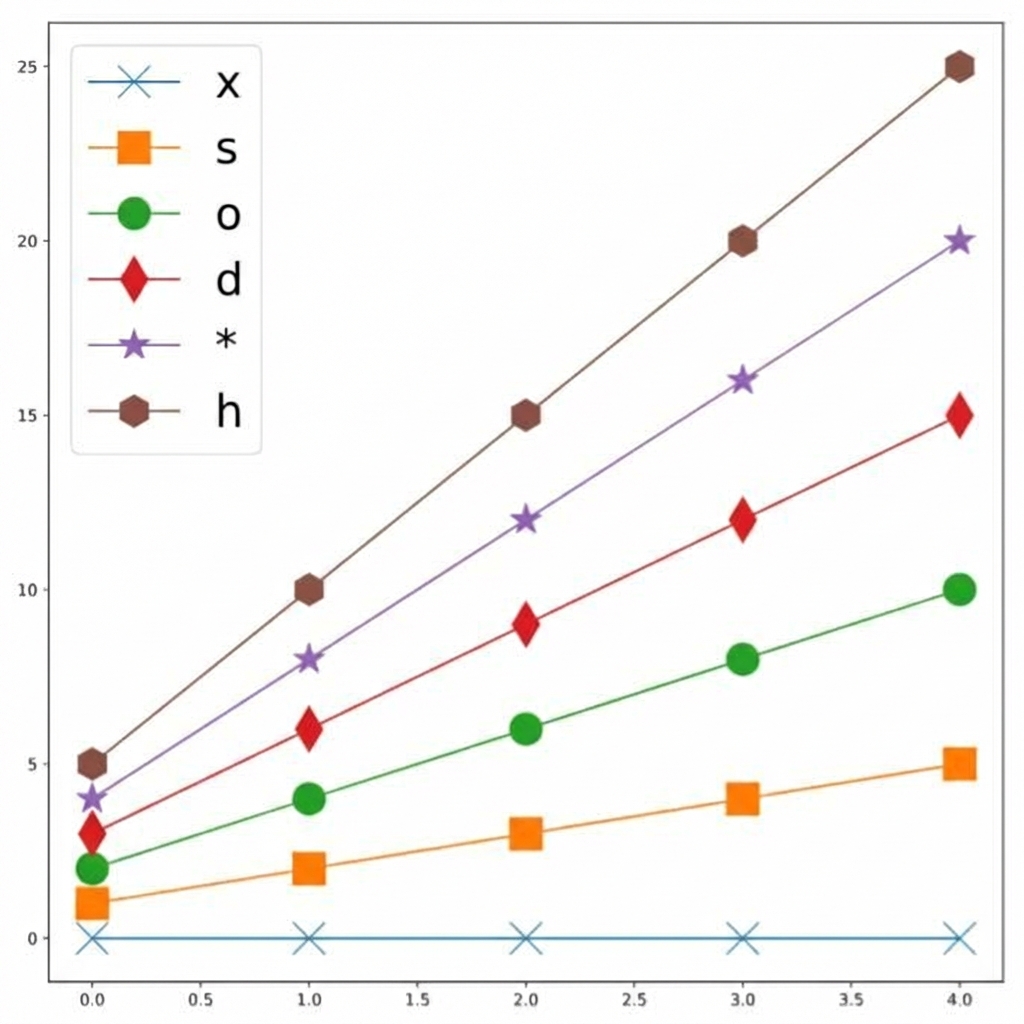
Menambahkan penanda
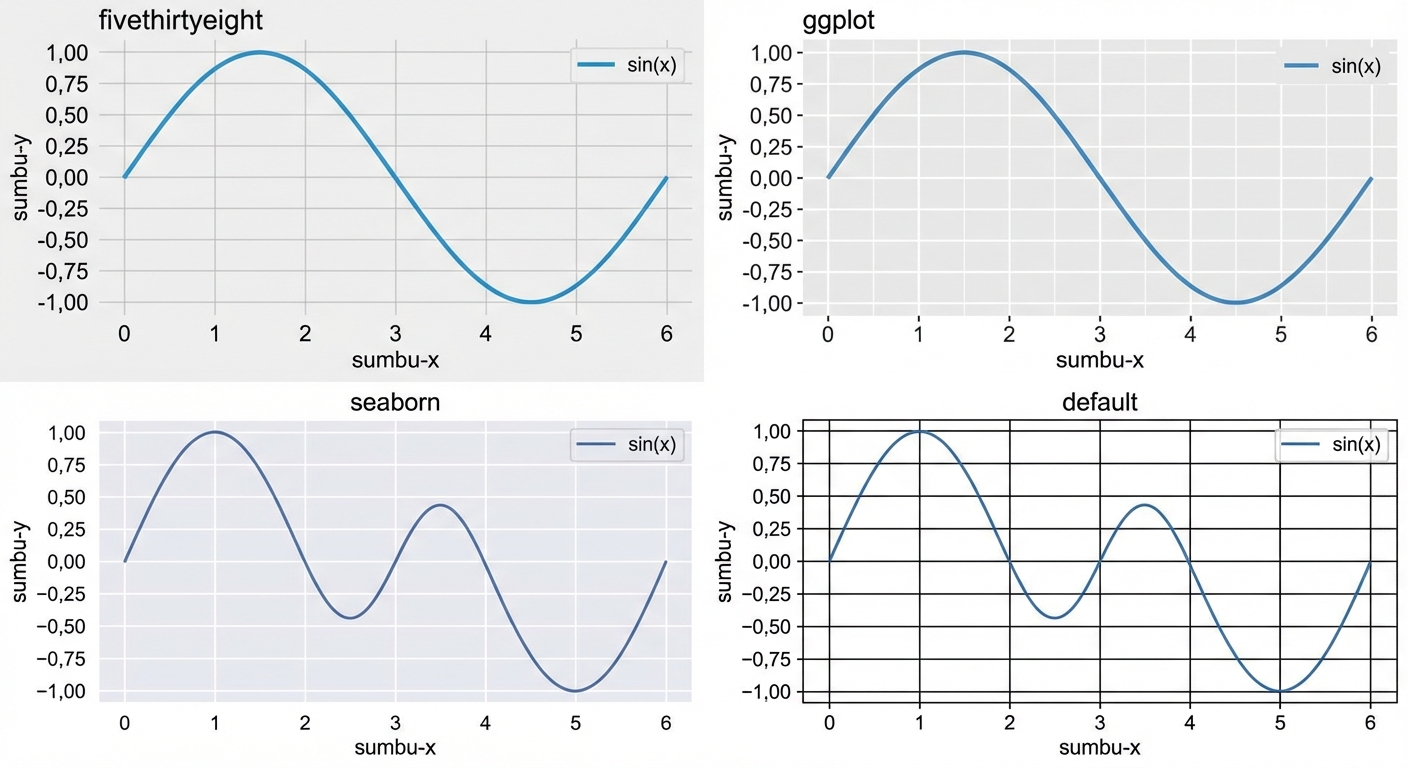
Mengatur style
Pengantar Data Science dengan Python
Hillary Green-Lerman
Senior Curriculum Lead, DataCamp

