Visualisasi di Python
Pengantar Python untuk Keuangan

Adina Howe
Professor
Matplotlib: paket visualisasi
Lihat galeri Matplotlib selengkapnya lewat tautan ini.
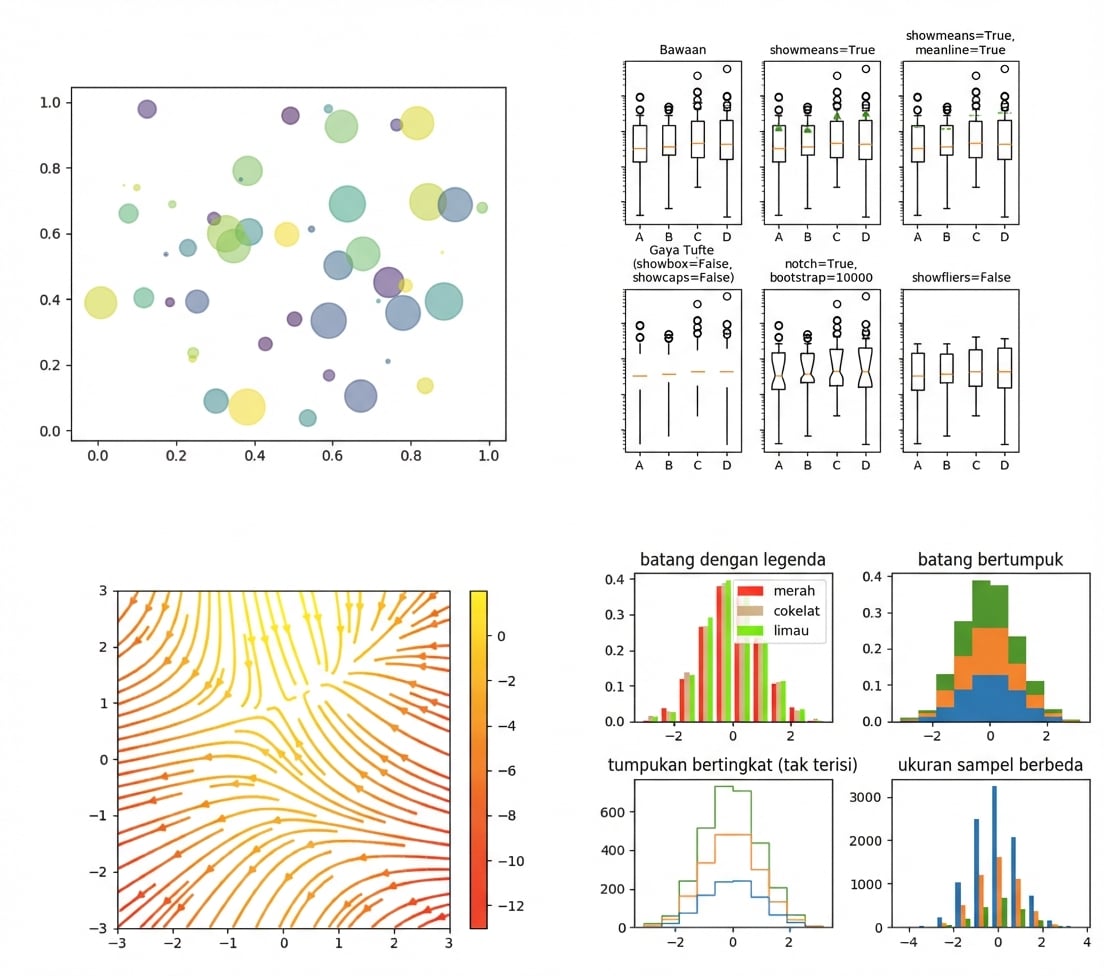
Hasil plot
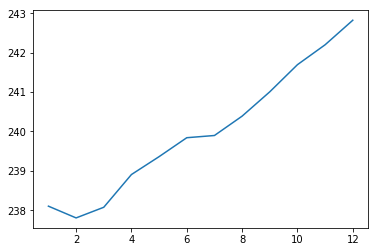
Hasil plot
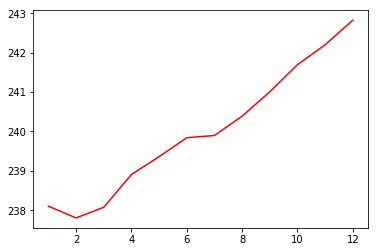
Hasil plot
Hasil plot
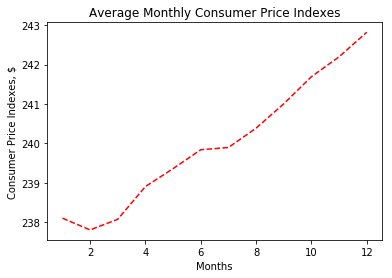
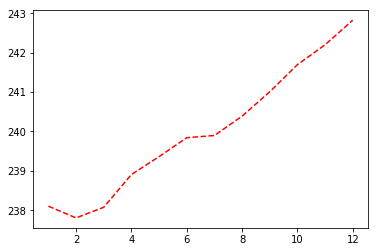
Hasil plot
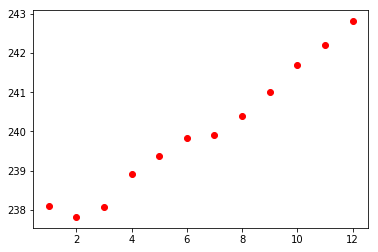
Hasil scatter plot
Pengantar Python untuk Keuangan
Adina Howe
Professor
Lihat galeri Matplotlib selengkapnya lewat tautan ini.

