Pencilan, leverage, dan pengaruh
Pengantar Regresi dengan statsmodels di Python

Maarten Van den Broeck
Content Developer at DataCamp
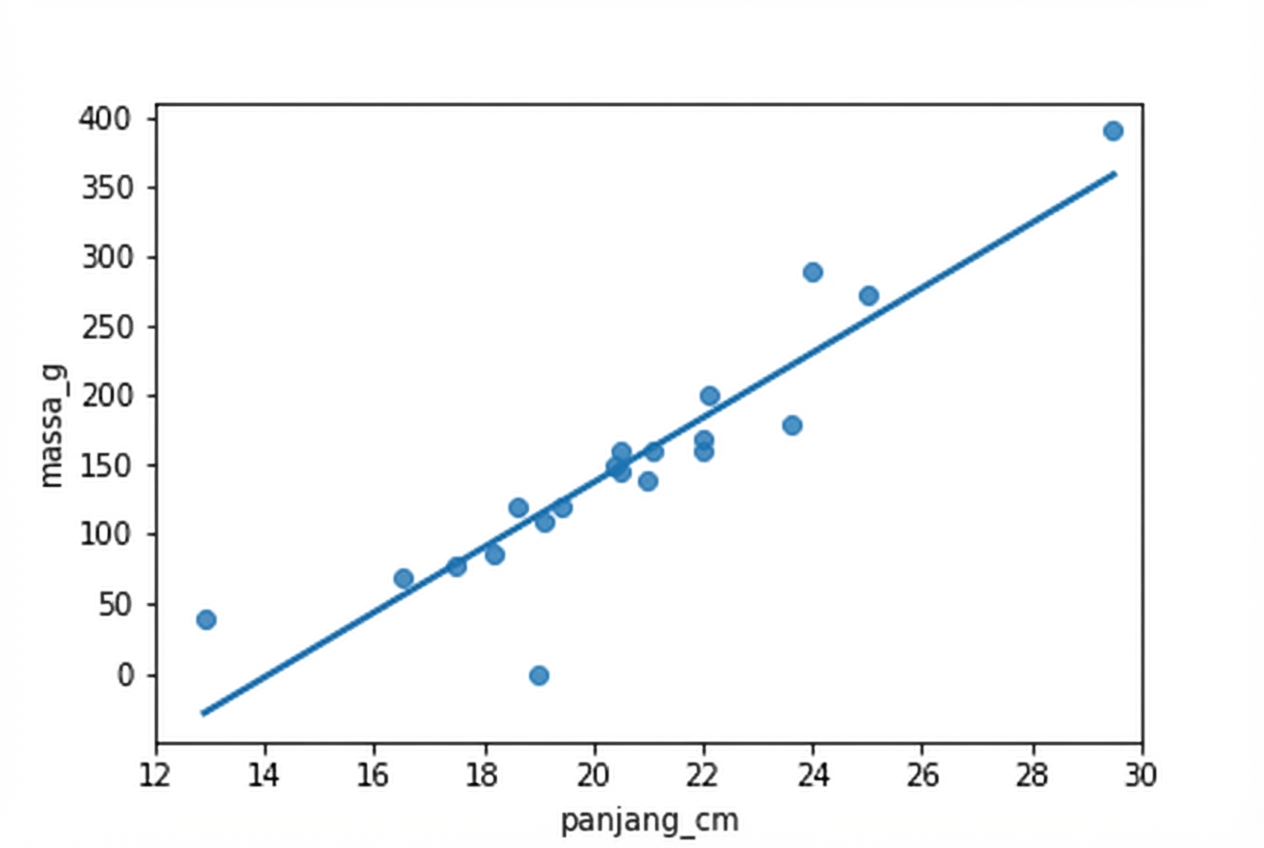
Dataset roach

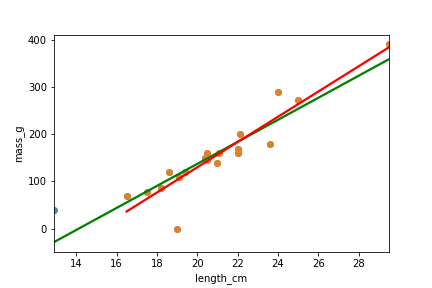
Titik mana yang merupakan pencilan?
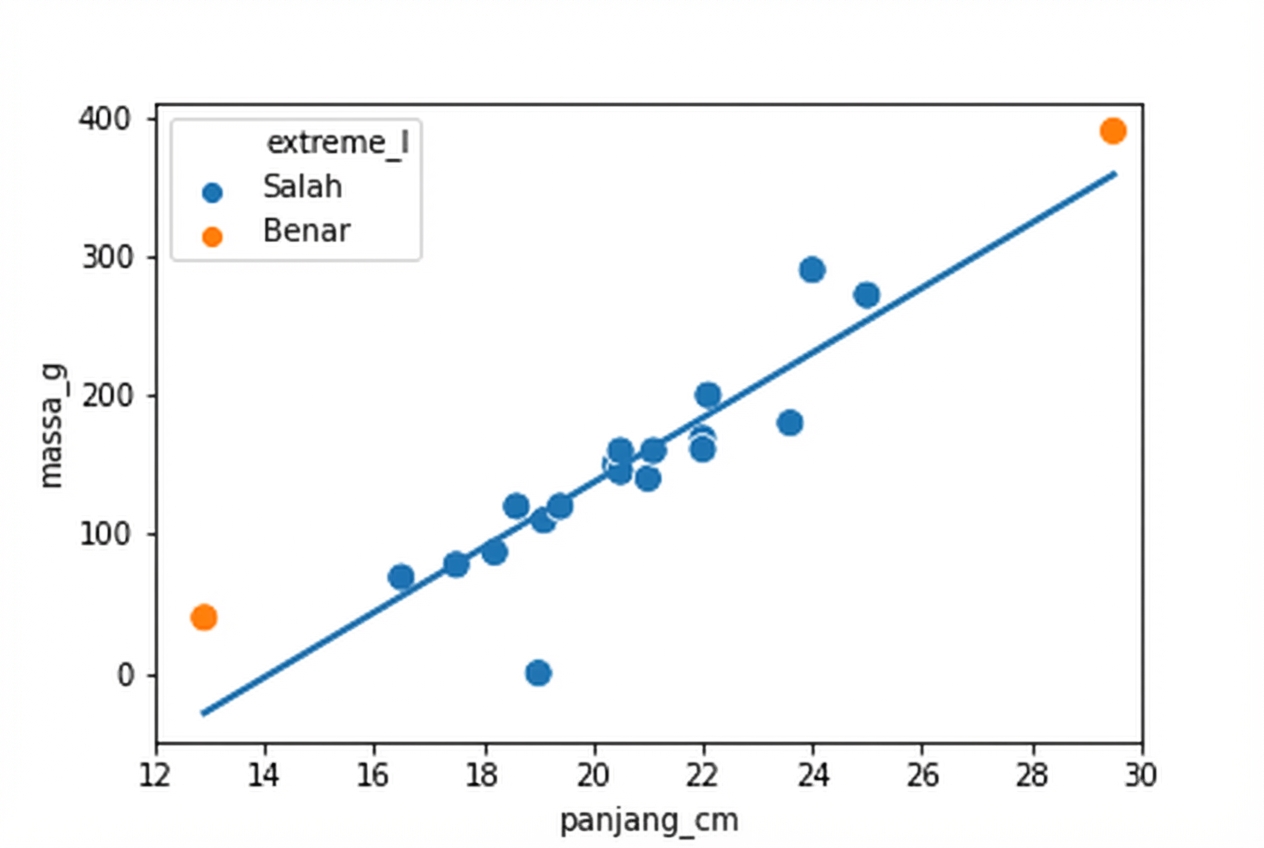
Nilai penjelas yang ekstrem
Nilai respons jauh dari garis regresi
Leverage dan pengaruh
Leverage mengukur seberapa ekstrem nilai variabel penjelas.
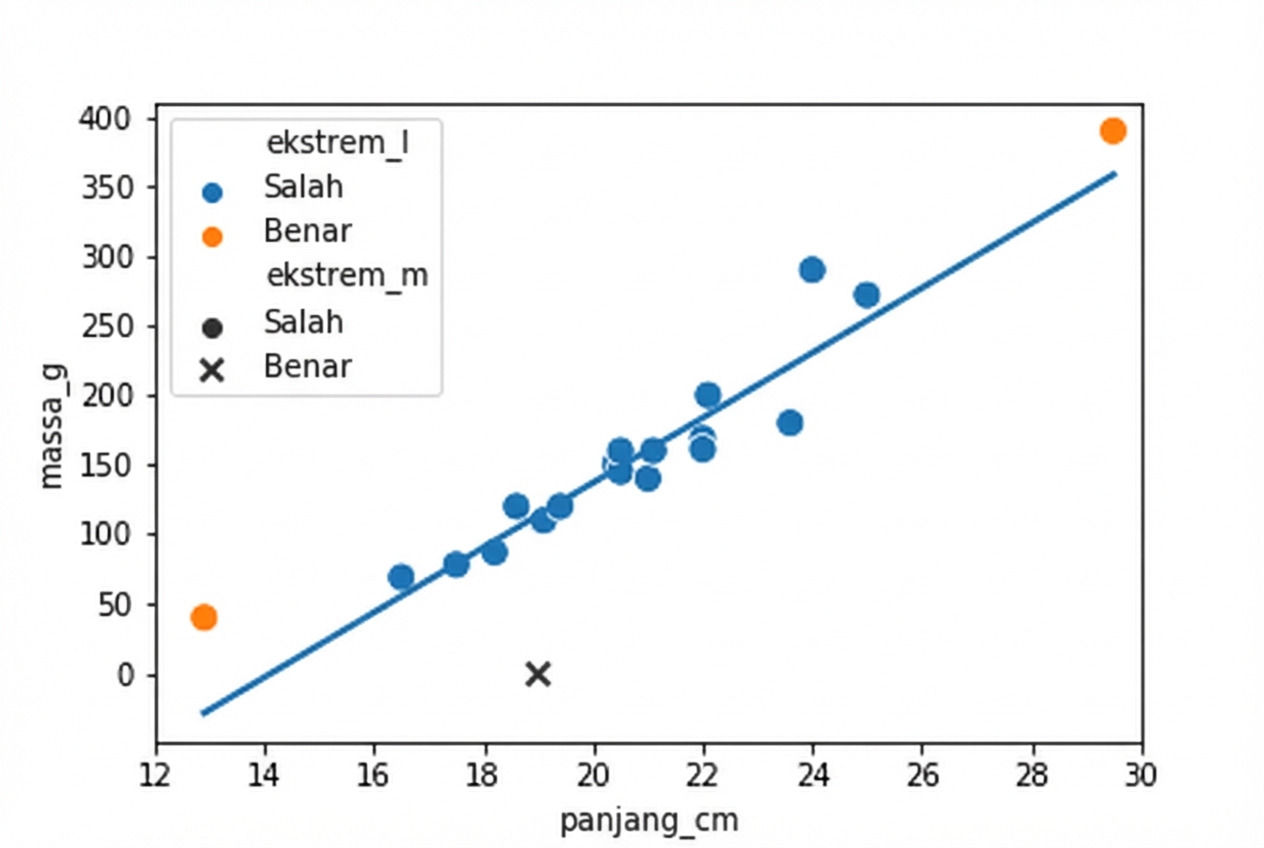
Pengaruh mengukur seberapa banyak model berubah jika pengamatan tersebut dihapus saat pemodelan.

Menghapus roach paling berpengaruh