Sampling kenyamanan
Sampling di Python

James Chapman
Curriculum Manager, DataCamp
Prediksi pemilu oleh The Literary Digest

- Prediksi: Landon 57%; Roosevelt 43%
- Hasil nyata: Landon 38%; Roosevelt 62%
- Sampel tidak mewakili populasi, menimbulkan bias sampel
- Mengumpulkan data dengan cara termudah disebut sampling kenyamanan
Mencari usia rata-rata orang Prancis

1 Gambar oleh Sean MacEntee
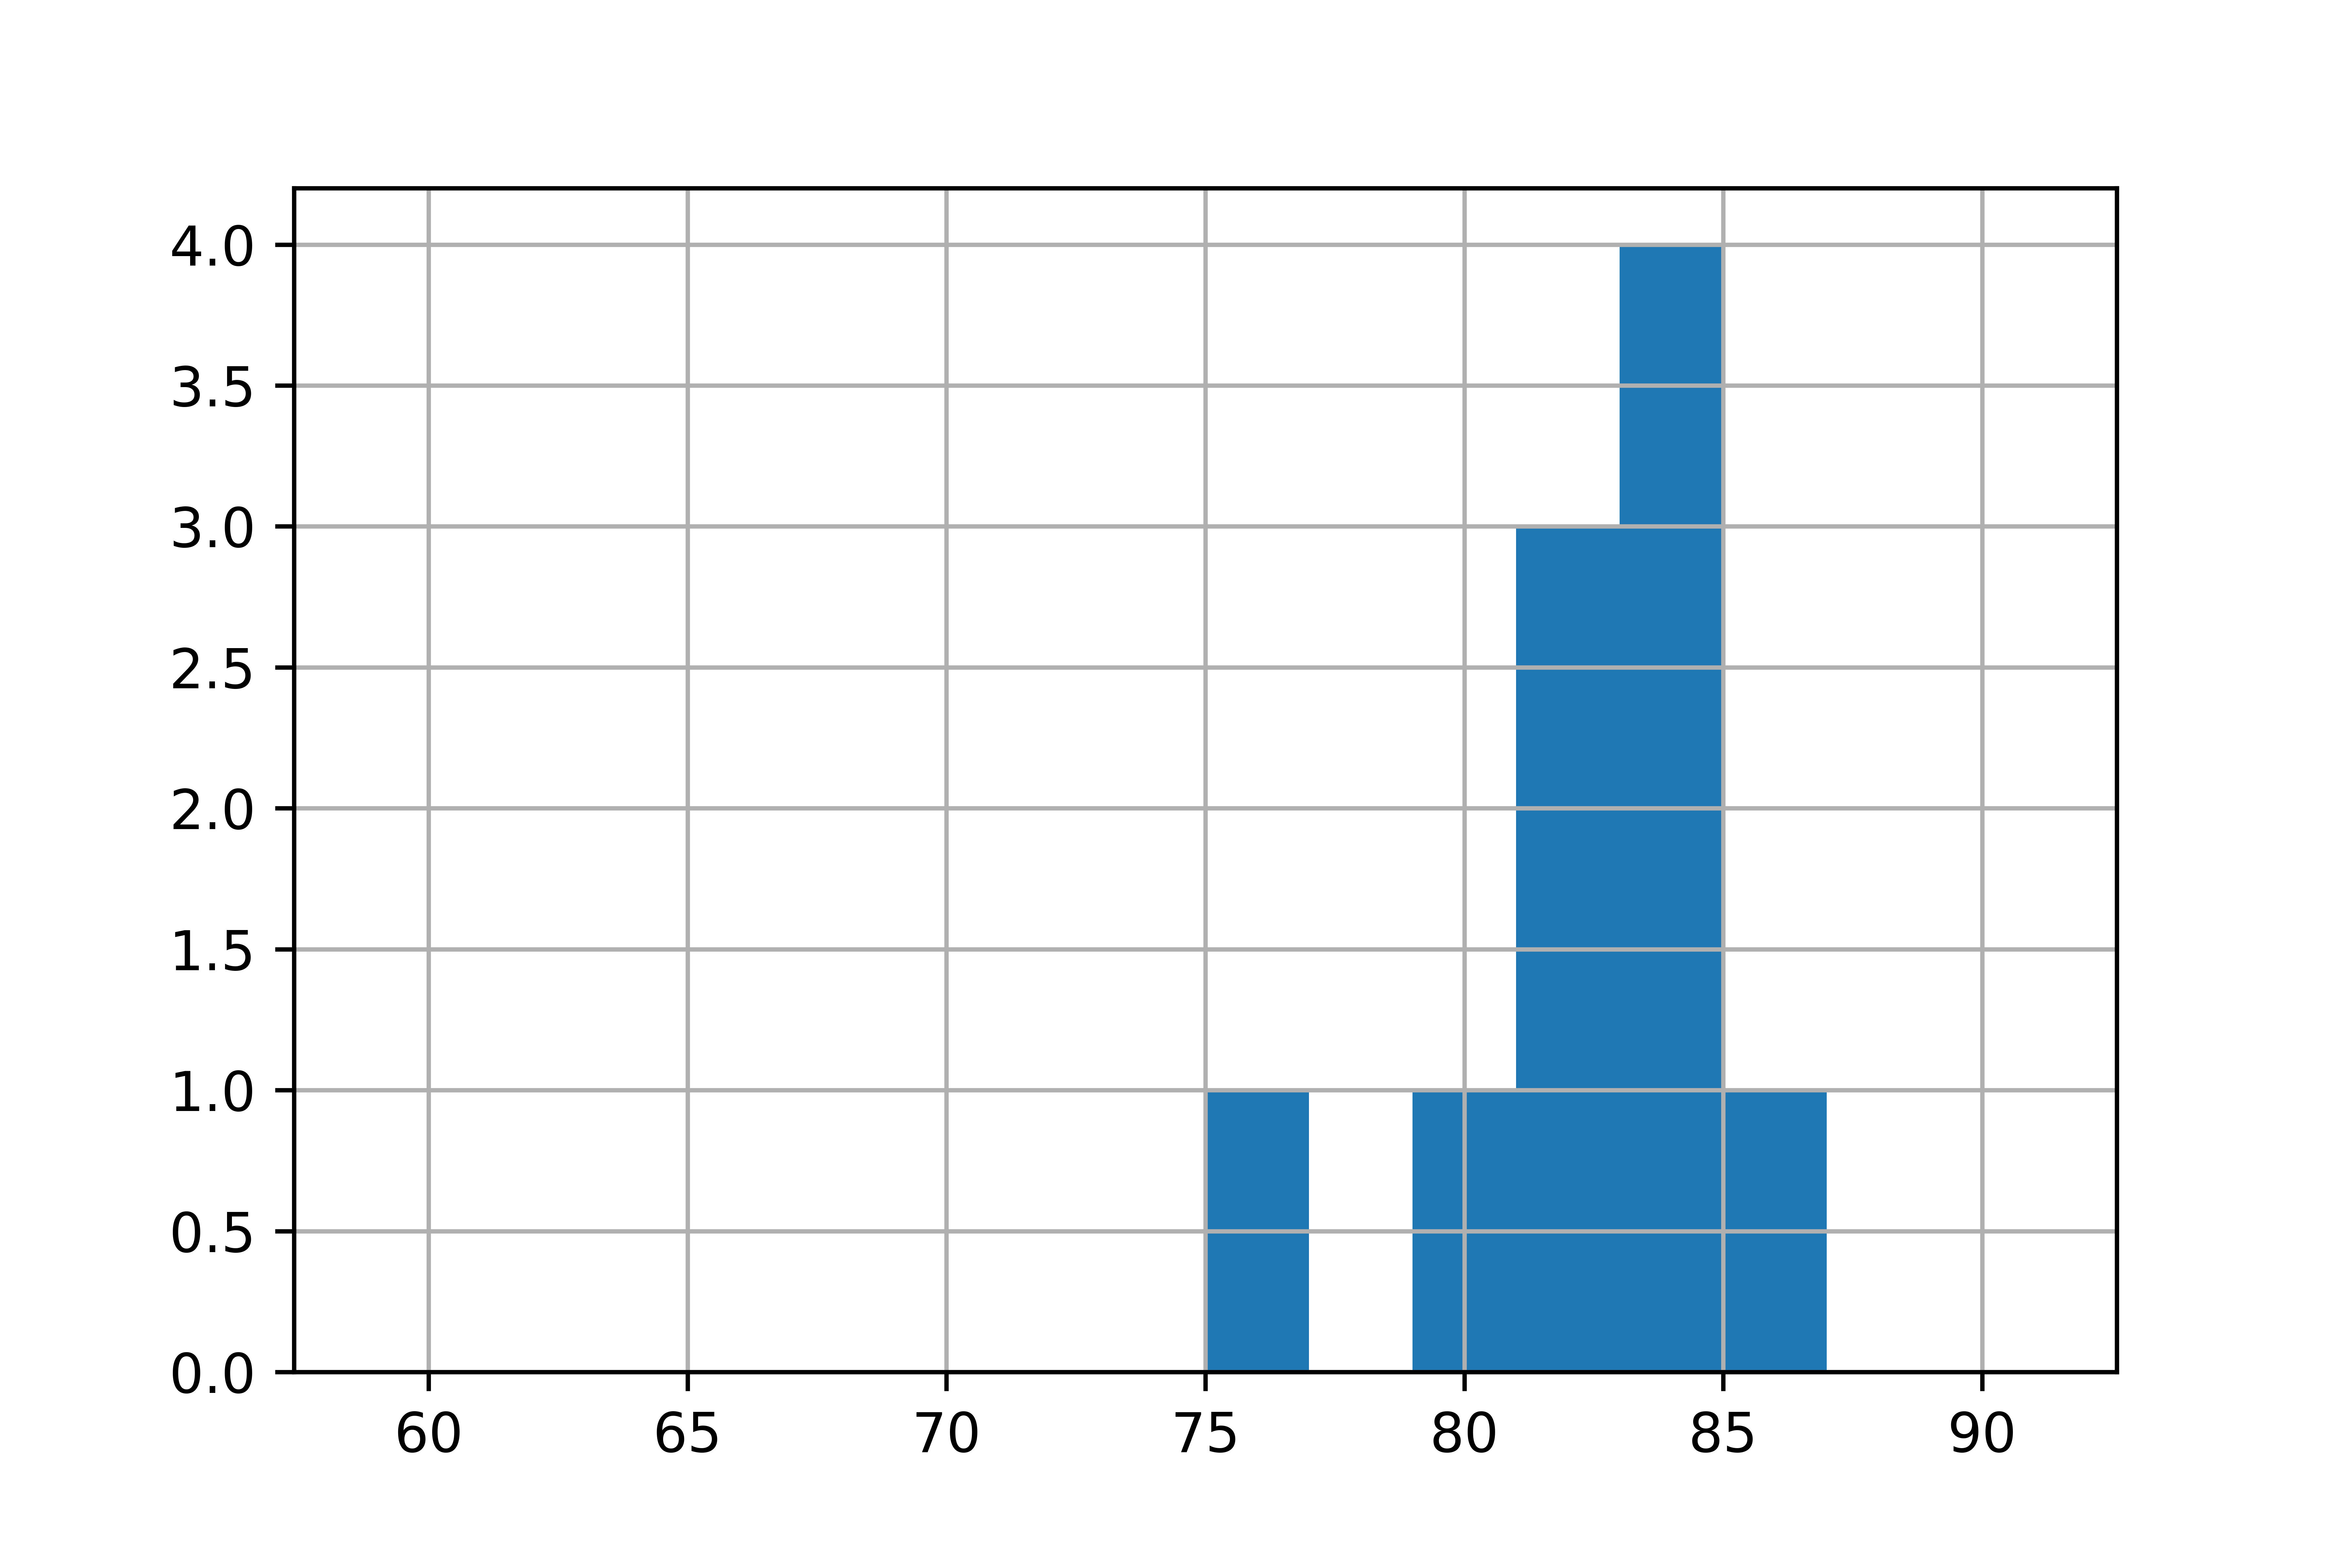
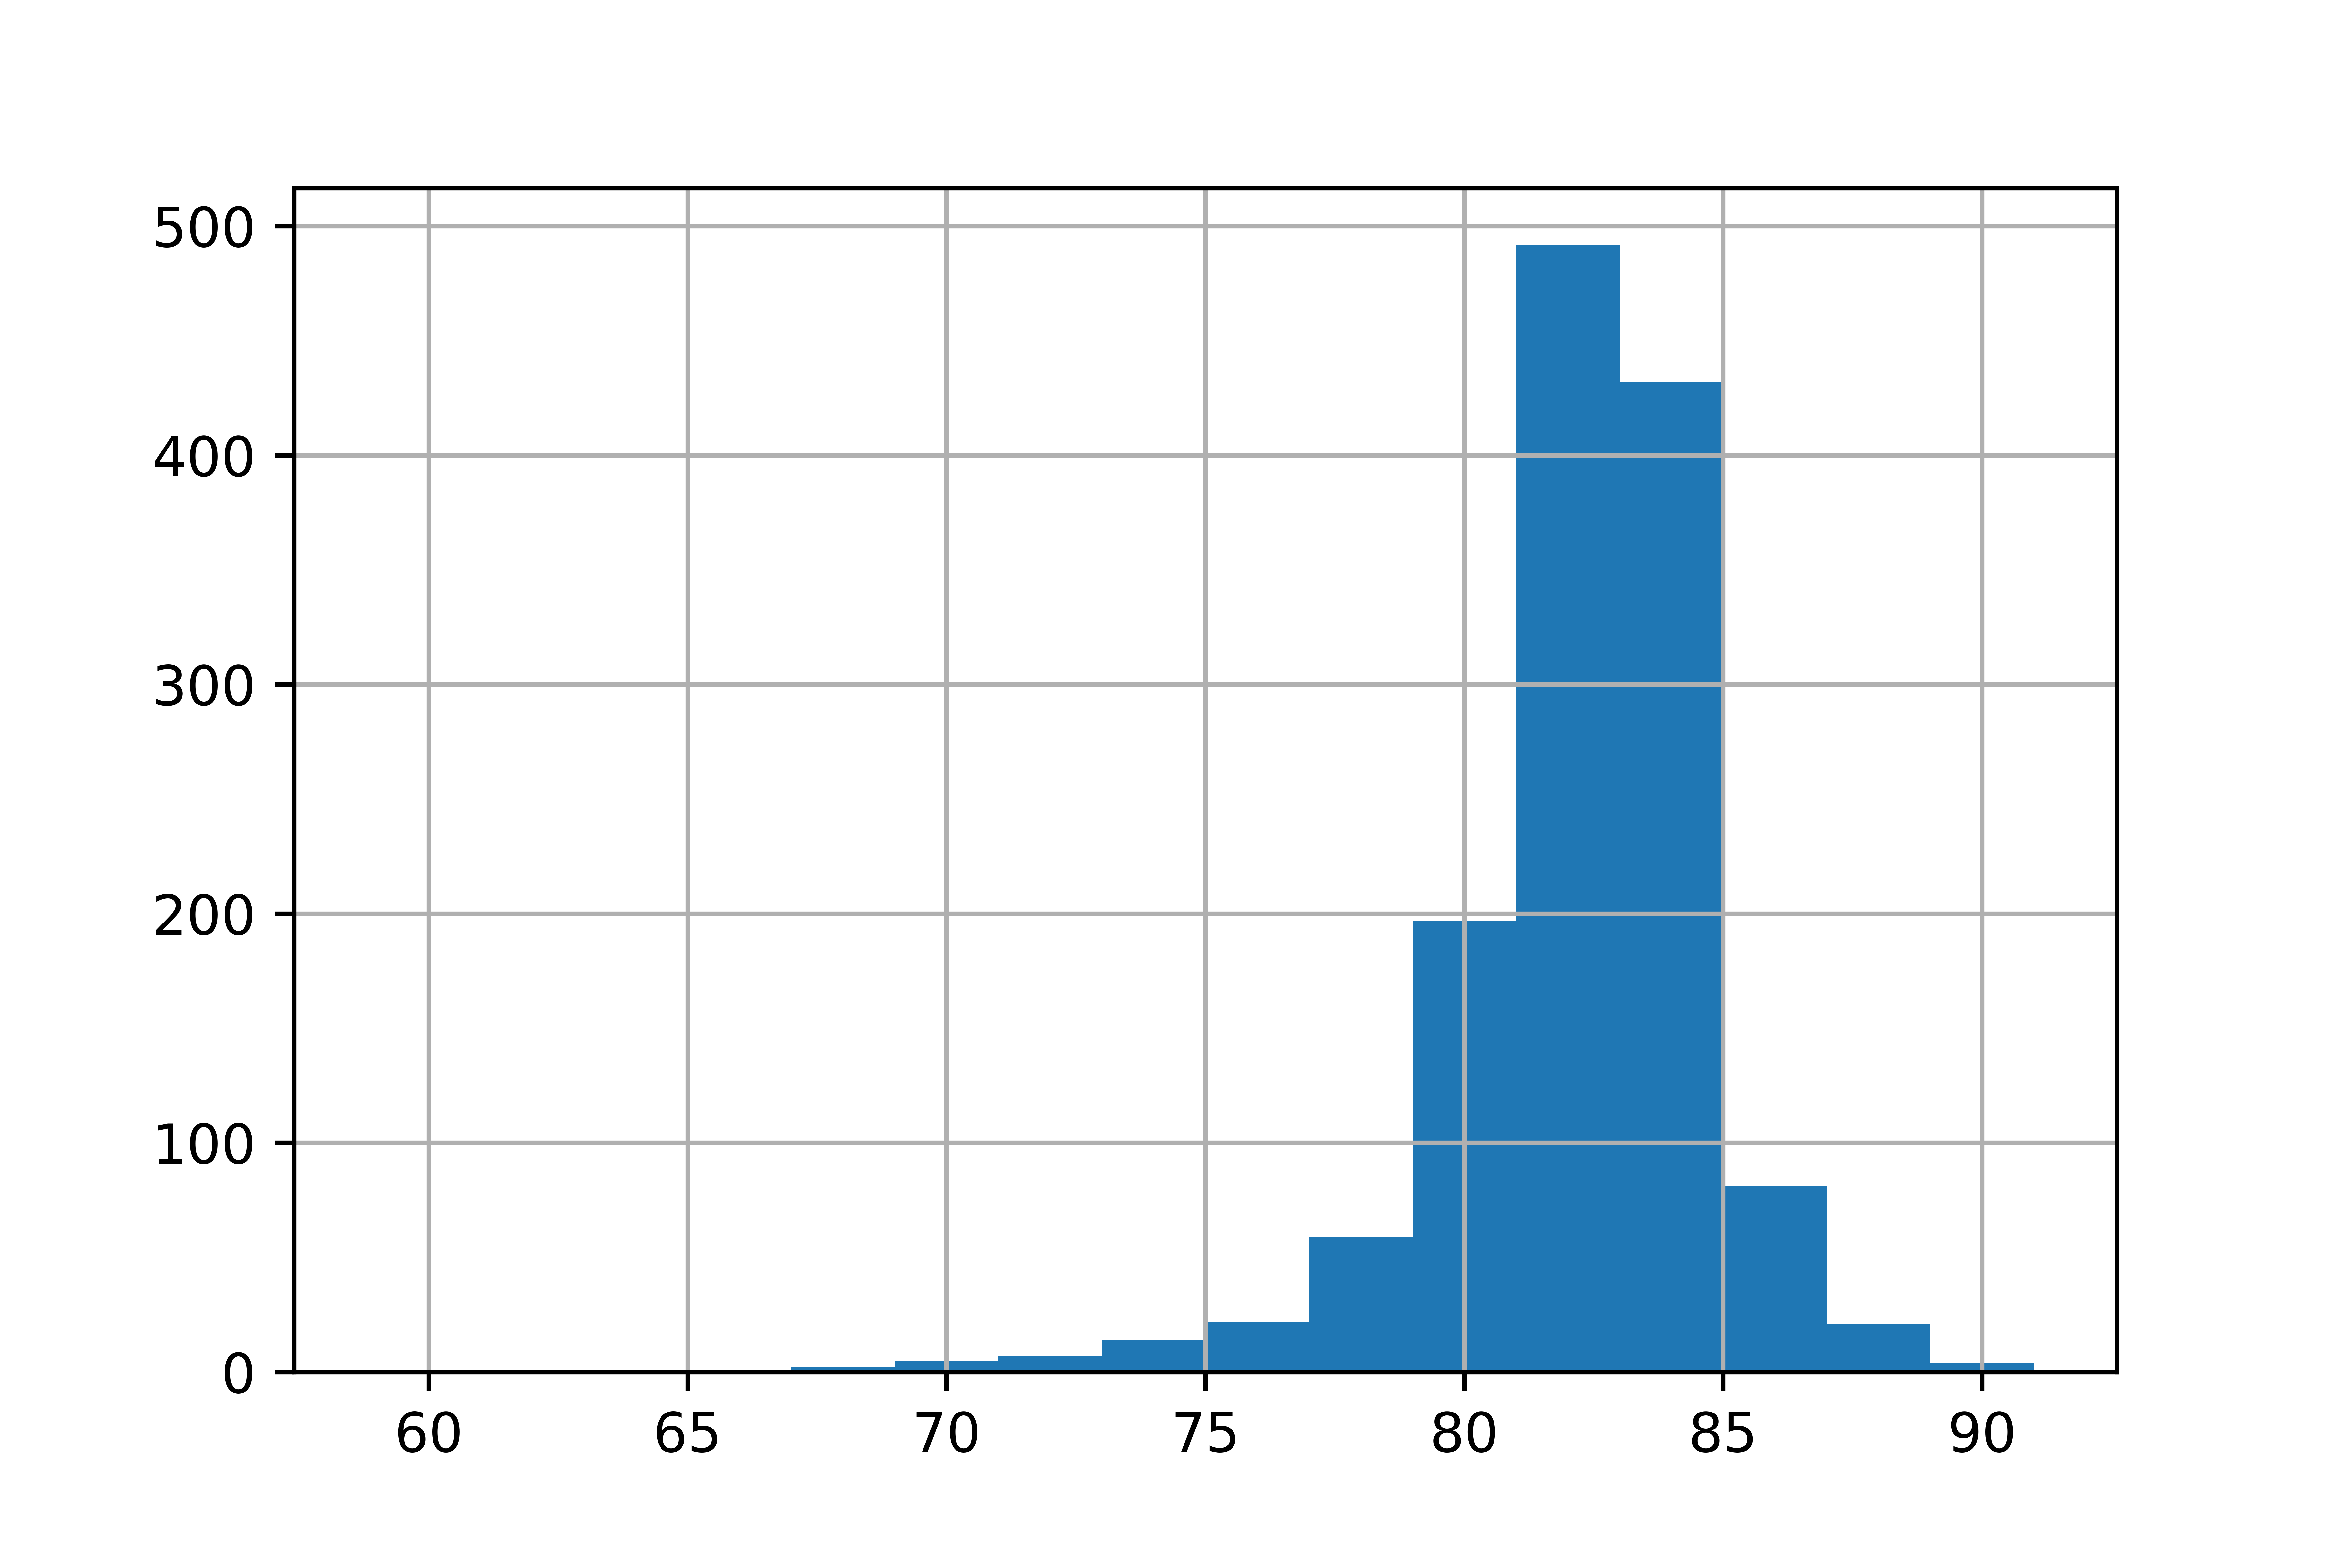
Distribusi populasi vs. sampel kenyamanan
Populasi:
Sampel kenyamanan:
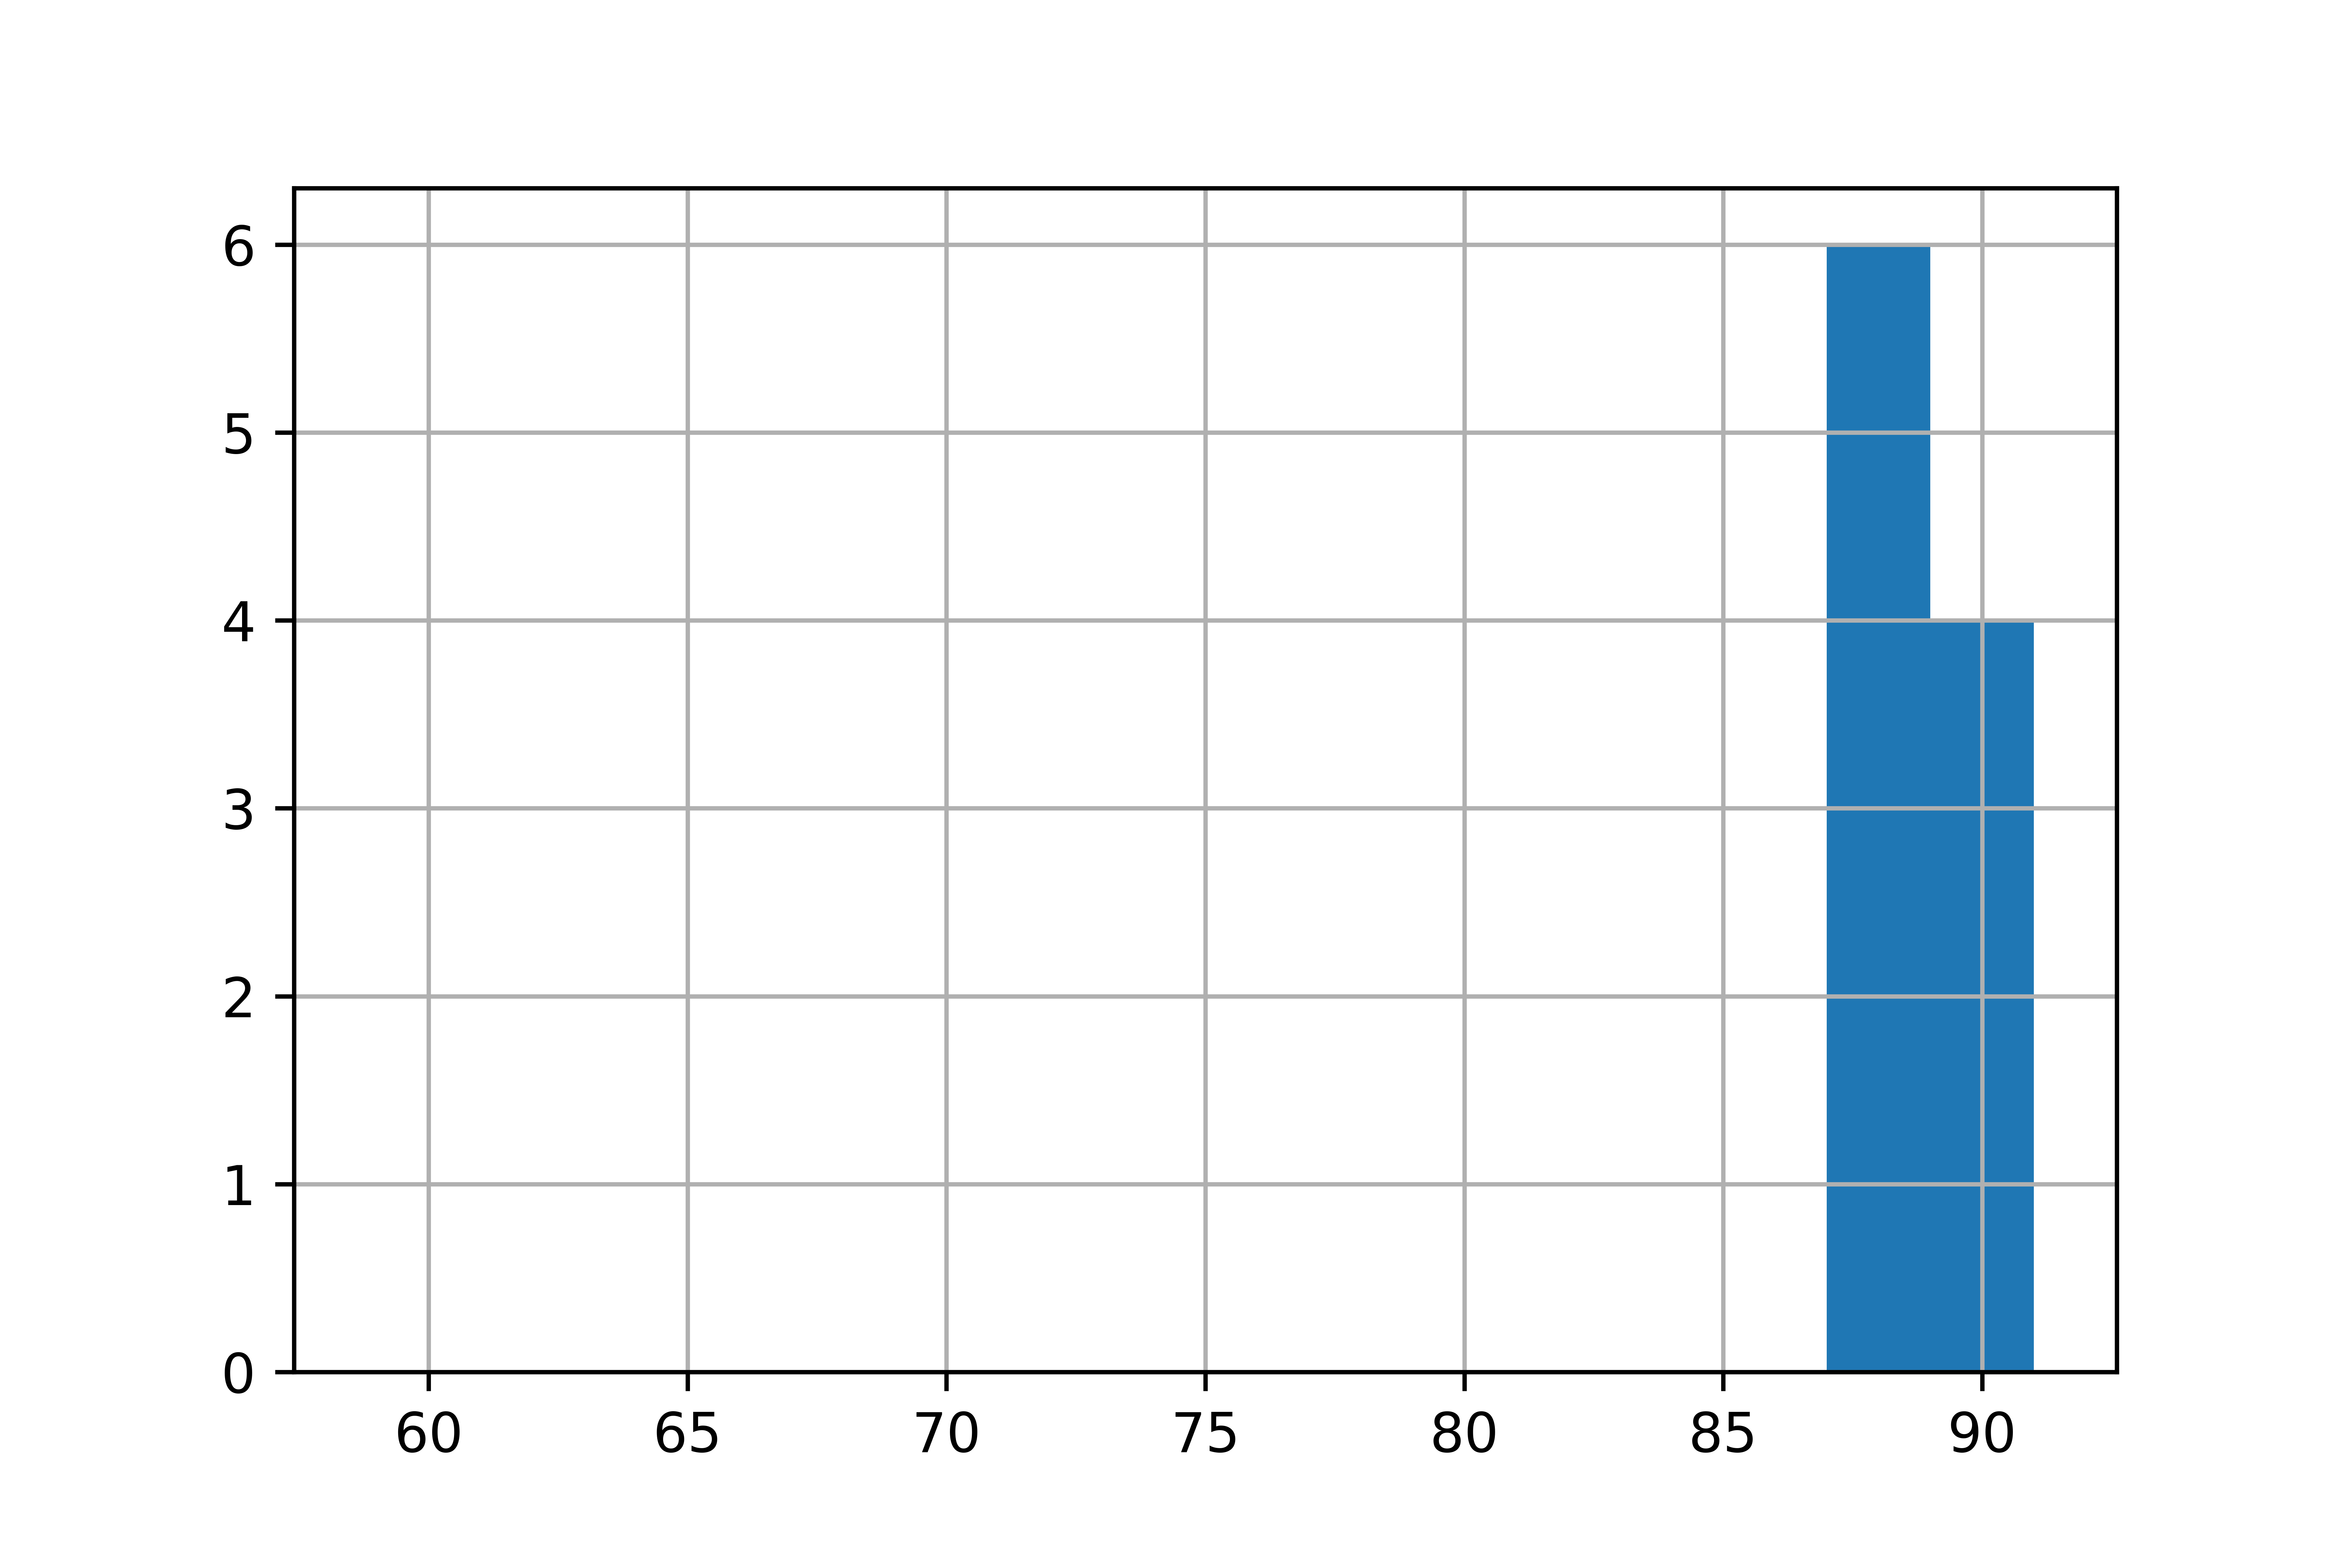
Distribusi populasi vs. sampel acak sederhana
Populasi:
Sampel acak: