Kustomisasi laporan dengan Q&A
Laporan di Power BI

Maarten Van den Broeck
Content Developer at DataCamp
Cara kerjanya
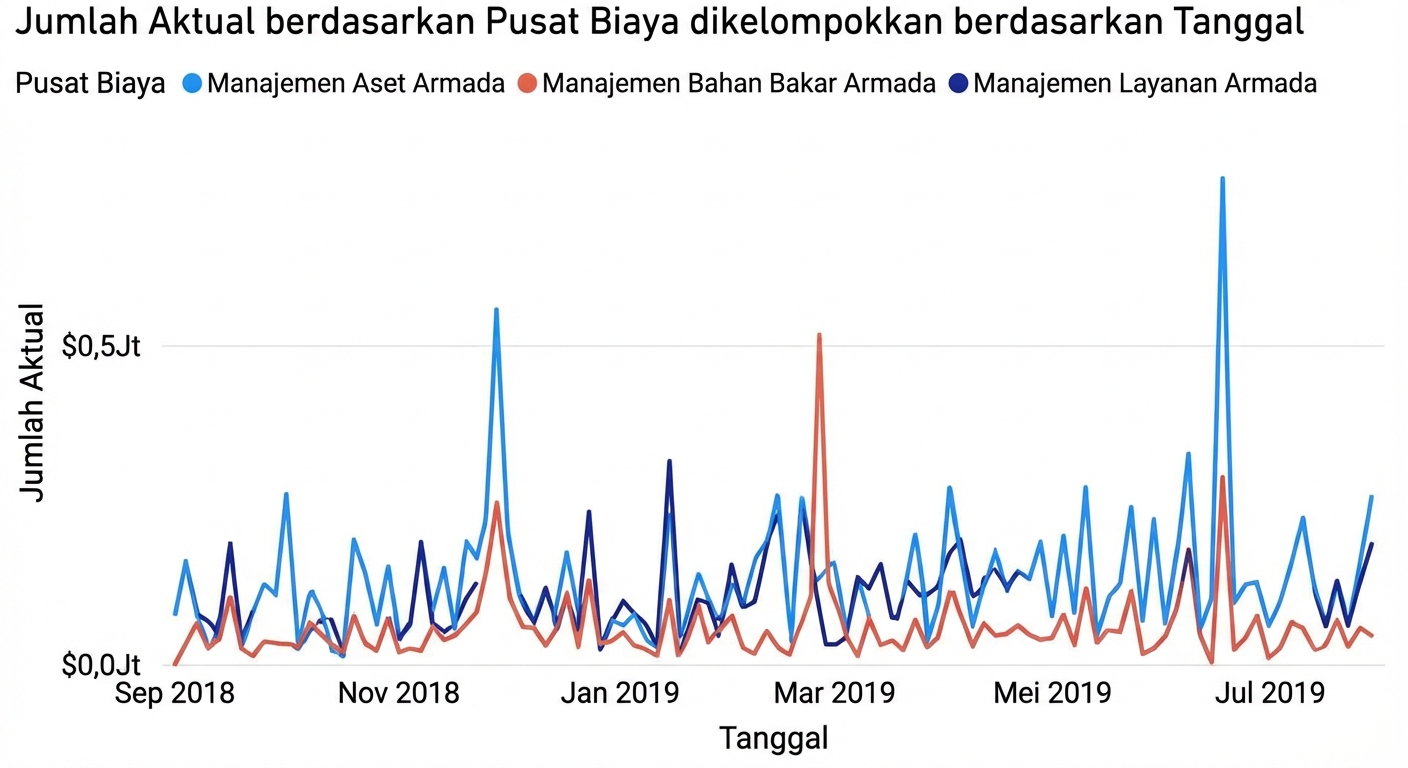
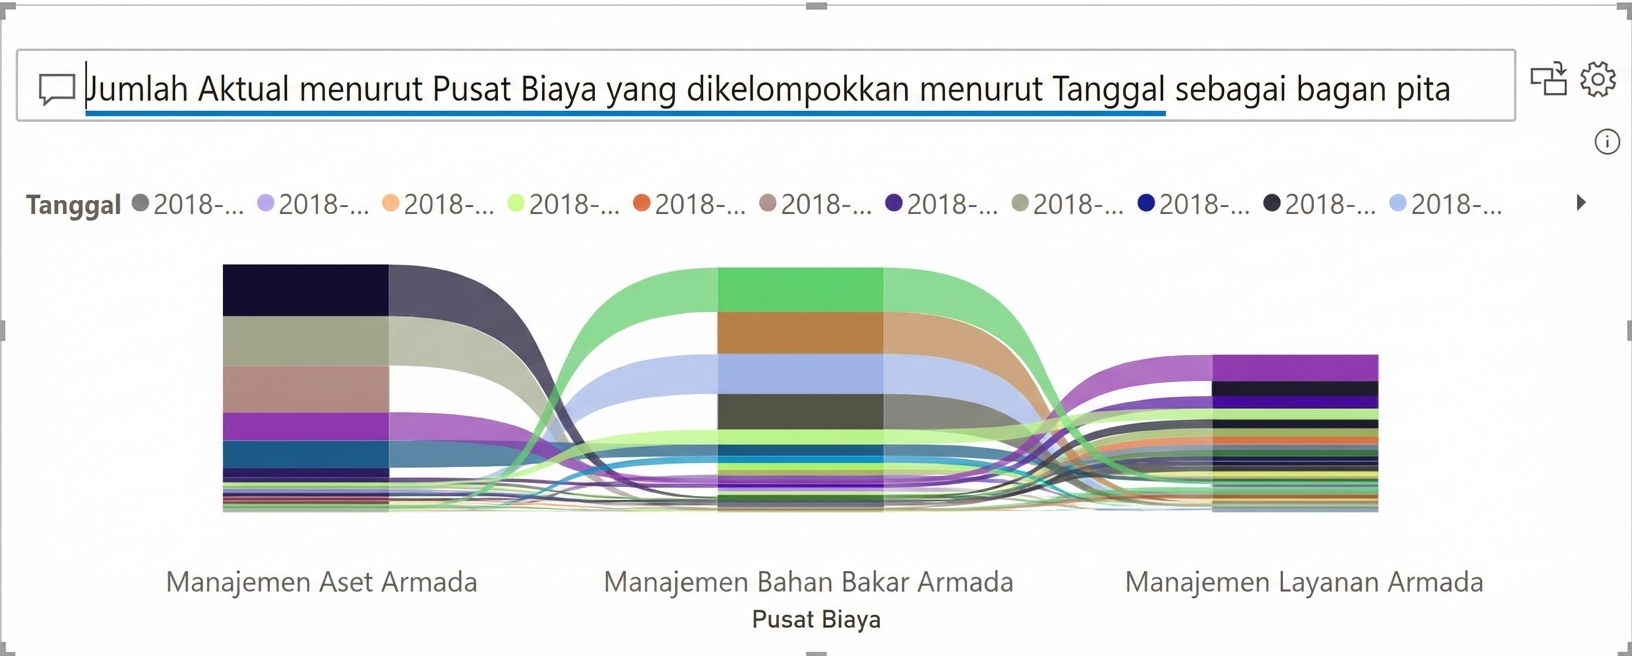
Meminta visual tertentu
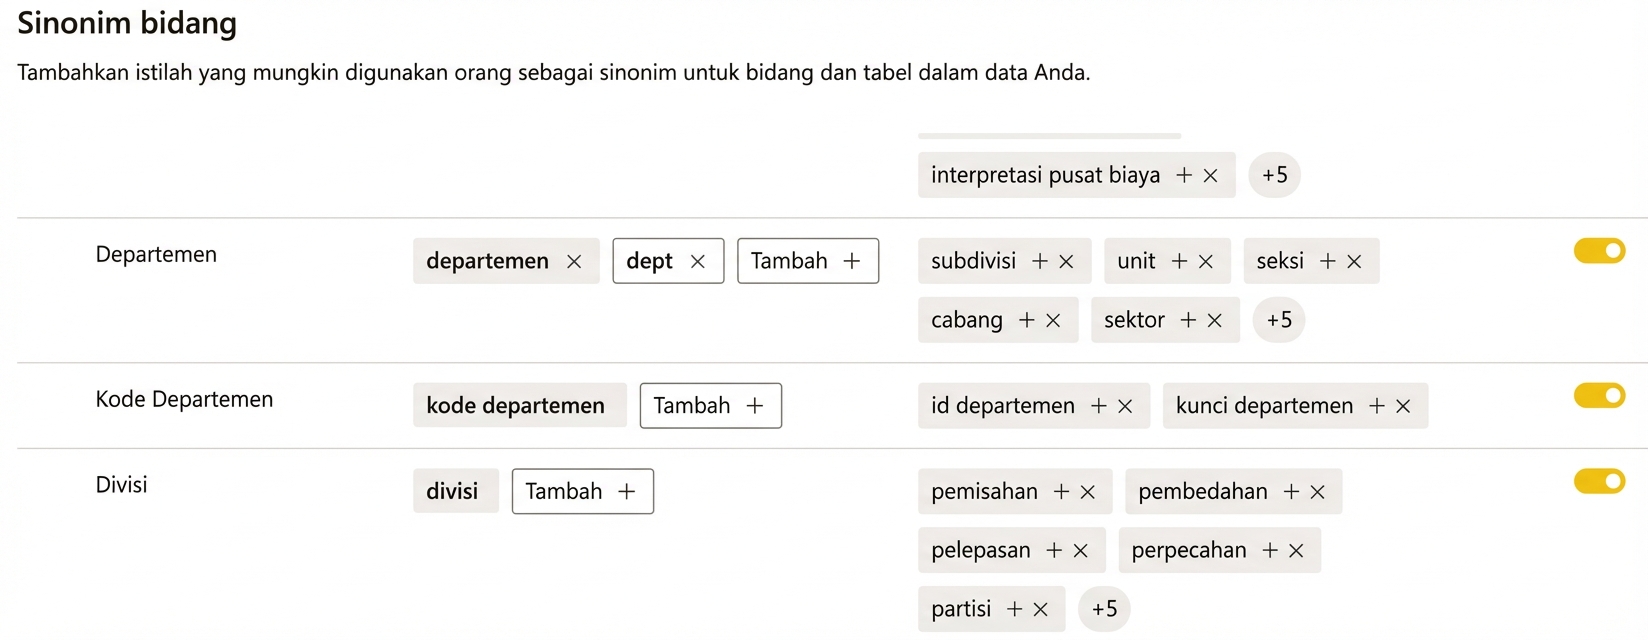
Sinonim
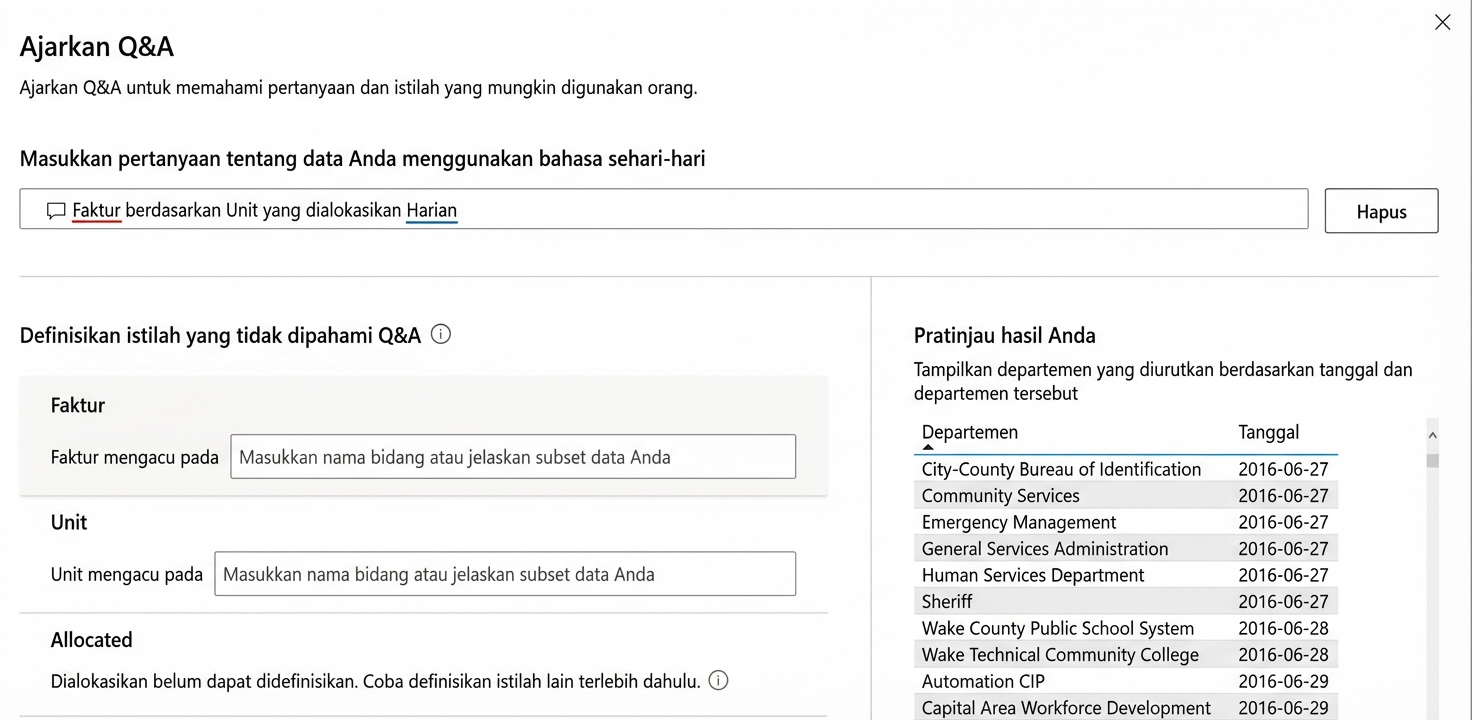
Mengelola istilah dengan Teach Q&A
Laporan di Power BI
Maarten Van den Broeck
Content Developer at DataCamp

