Plot semua data Anda: Bee swarm plot
Berpikir Statistis dengan Python (Bagian 1)

Justin Bois
Teaching Professor at the California Institute of Technology
Hasil pemilu 2008 AS di swing state
1 Data diambil dari Data.gov (https://www.data.gov/)
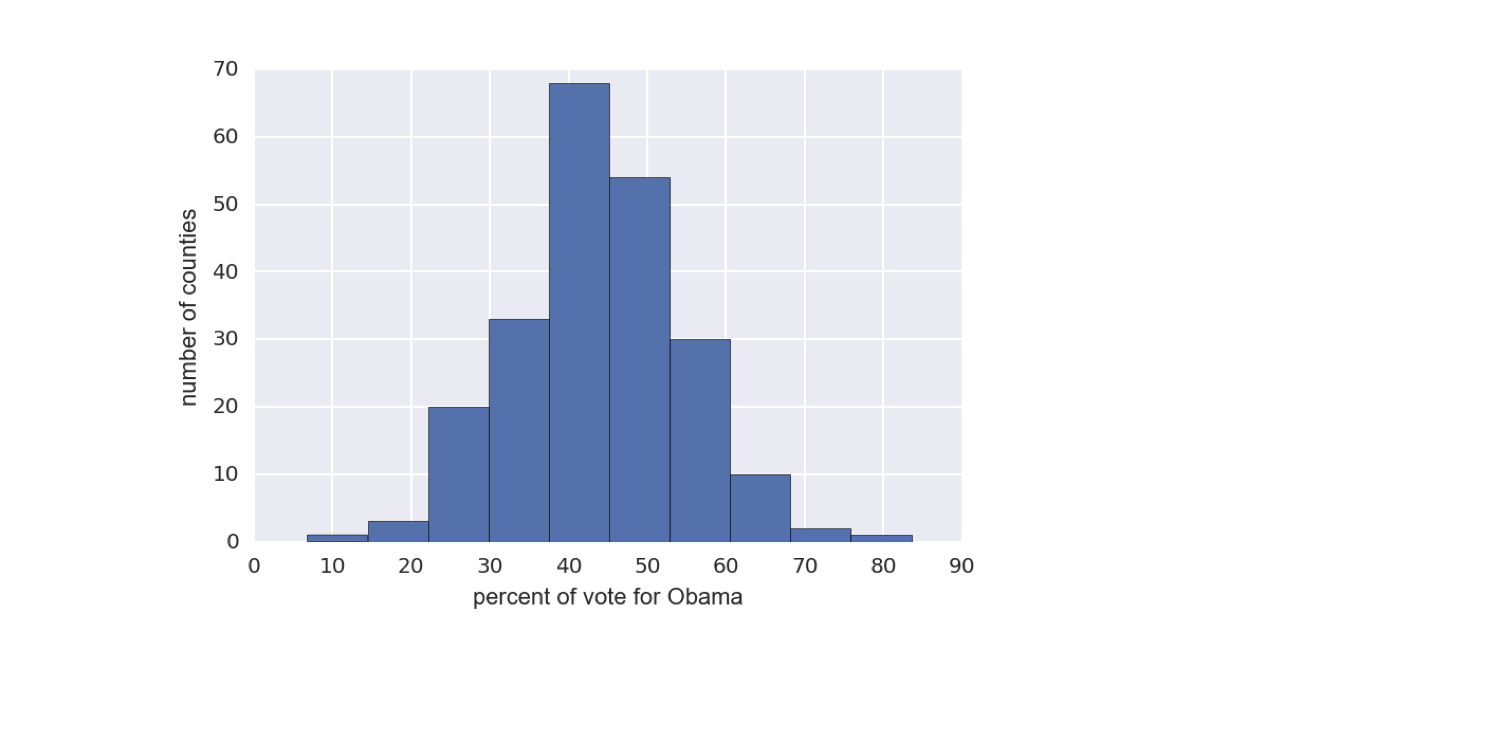
Hasil pemilu 2008 AS di swing state
1 Data diambil dari Data.gov (https://www.data.gov/)
Bee swarm plot
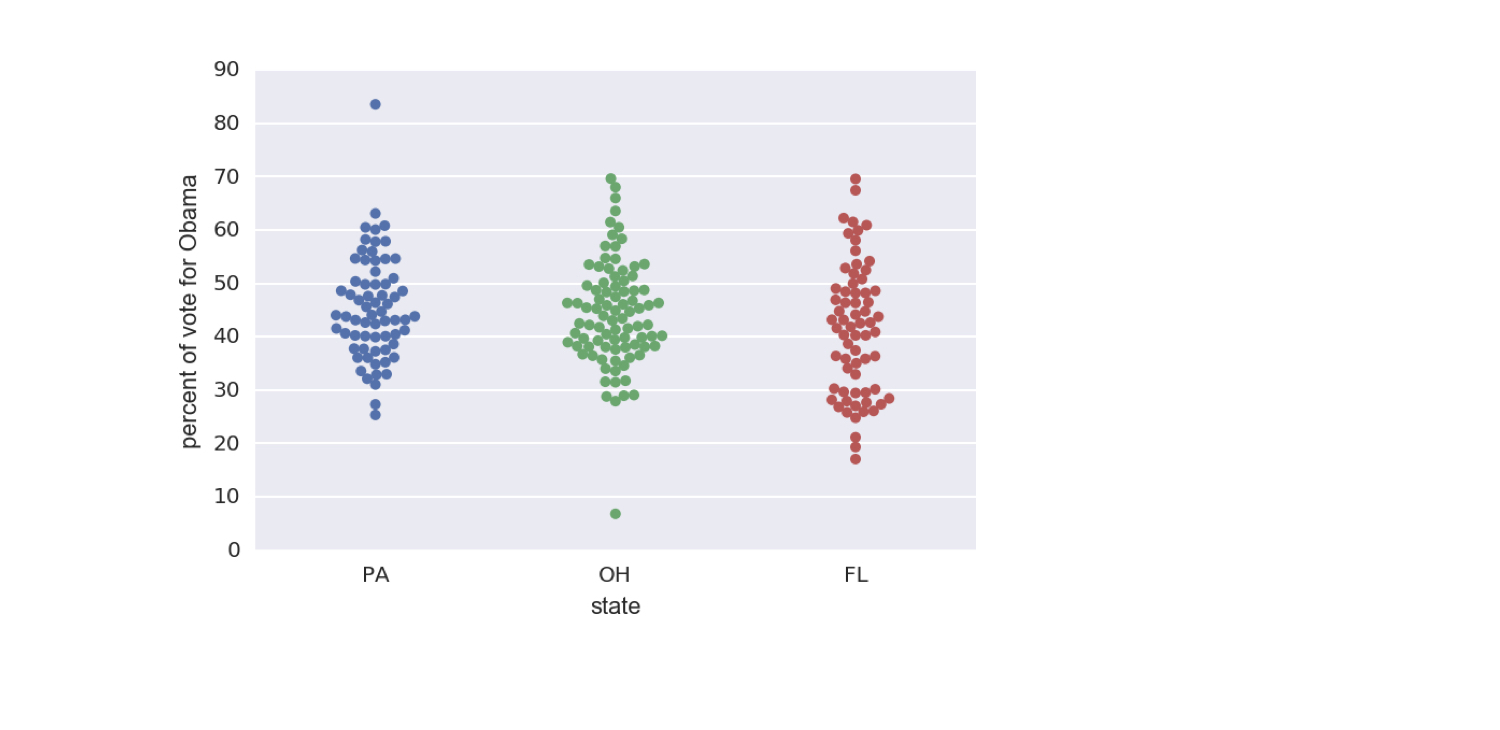
1 Data diambil dari Data.gov (https://www.data.gov/)
Struktur data frame
1 Data diambil dari Data.gov (https://www.data.gov/)
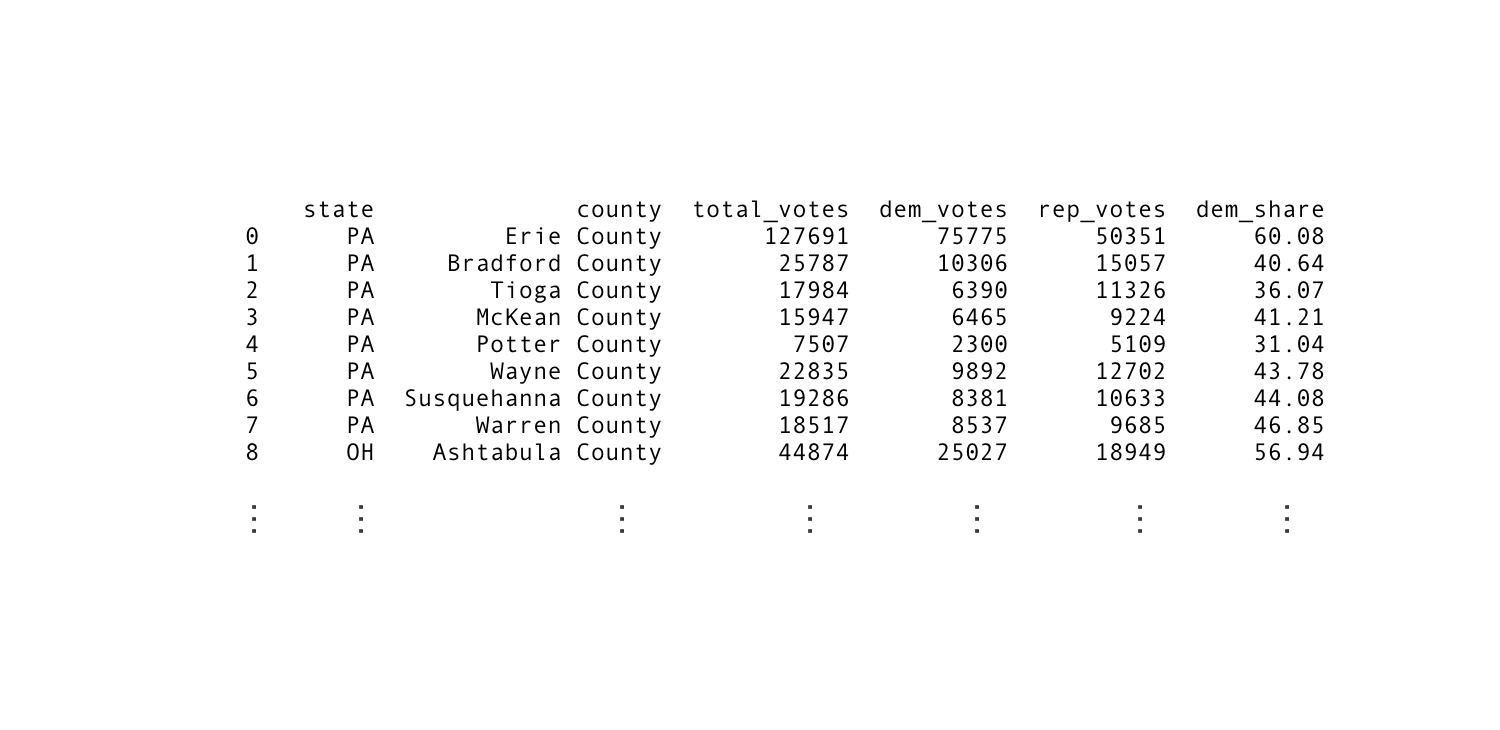
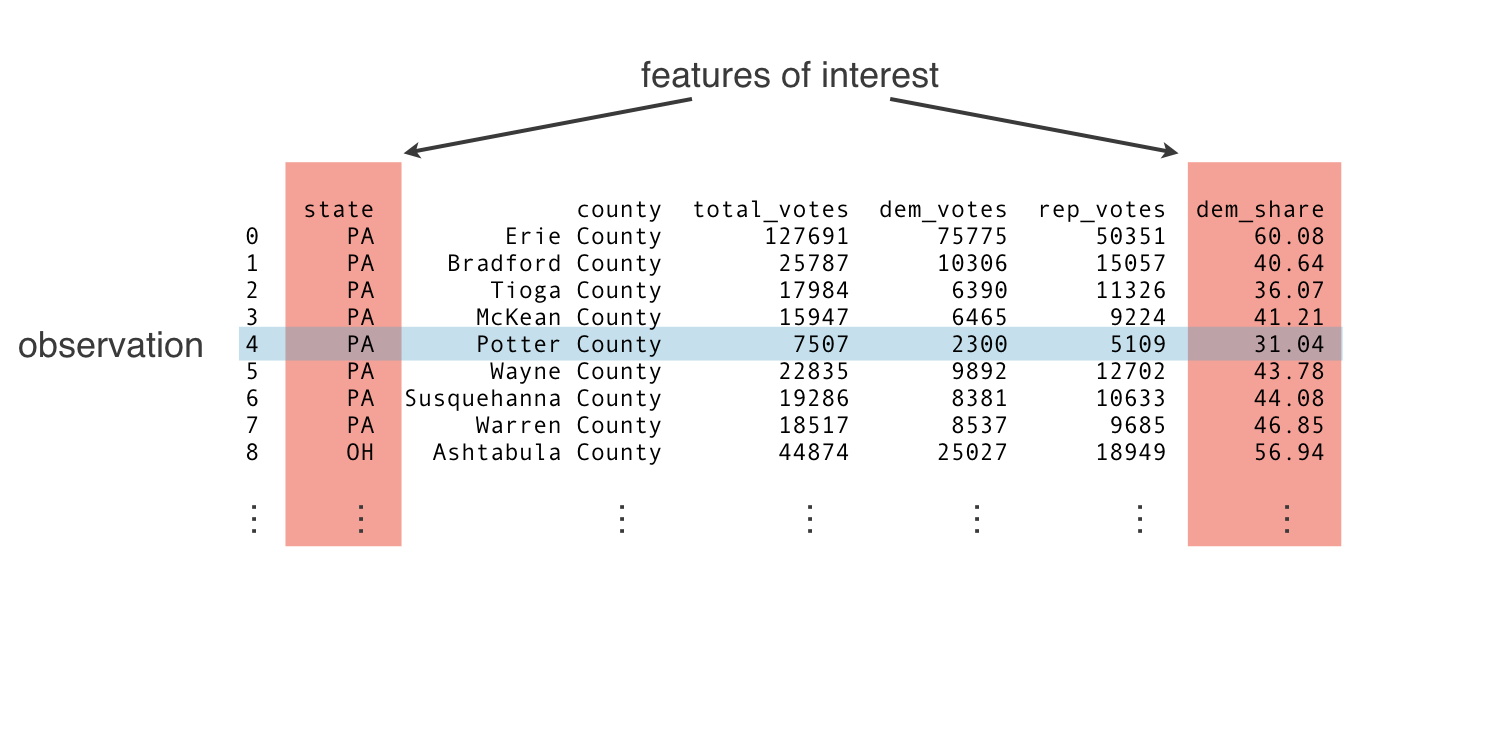
Struktur data frame
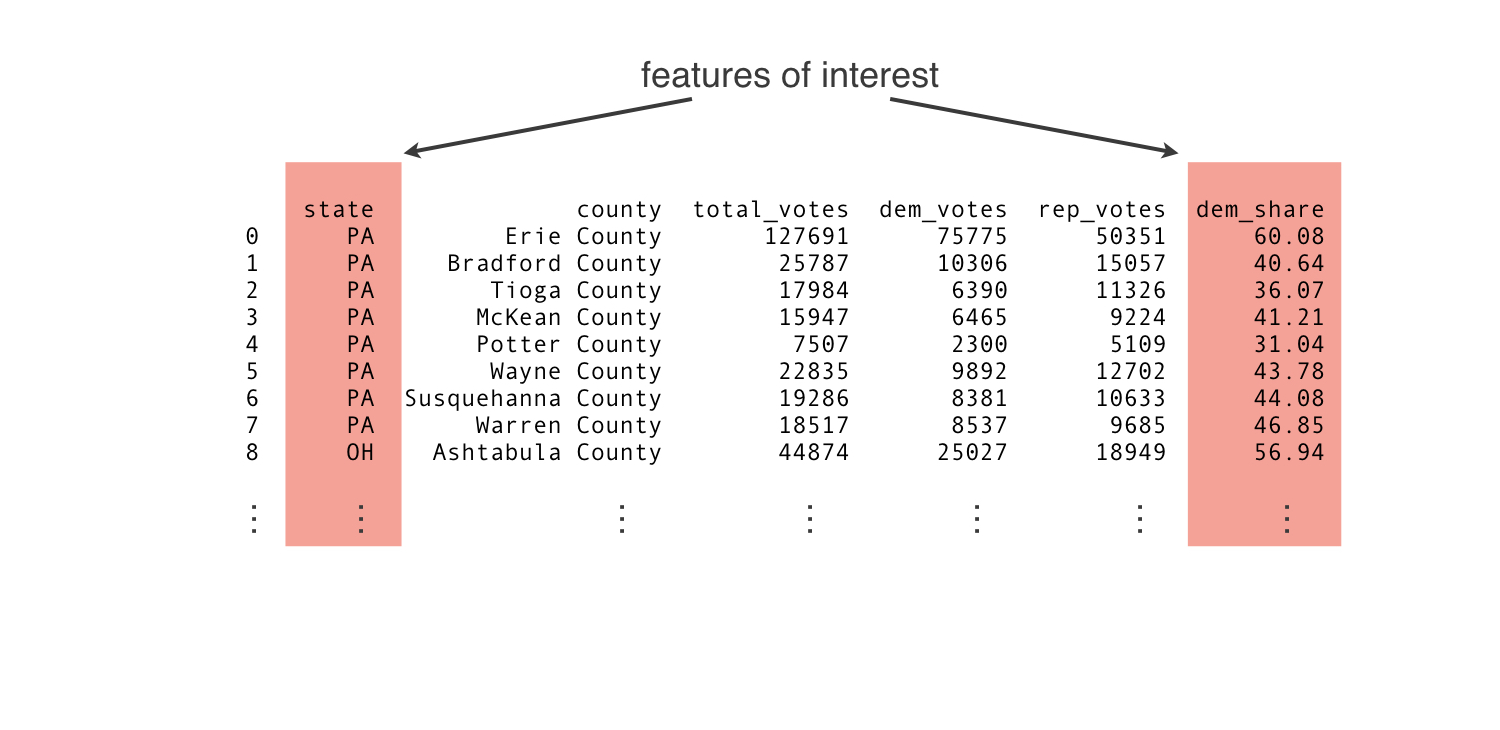
Struktur data frame
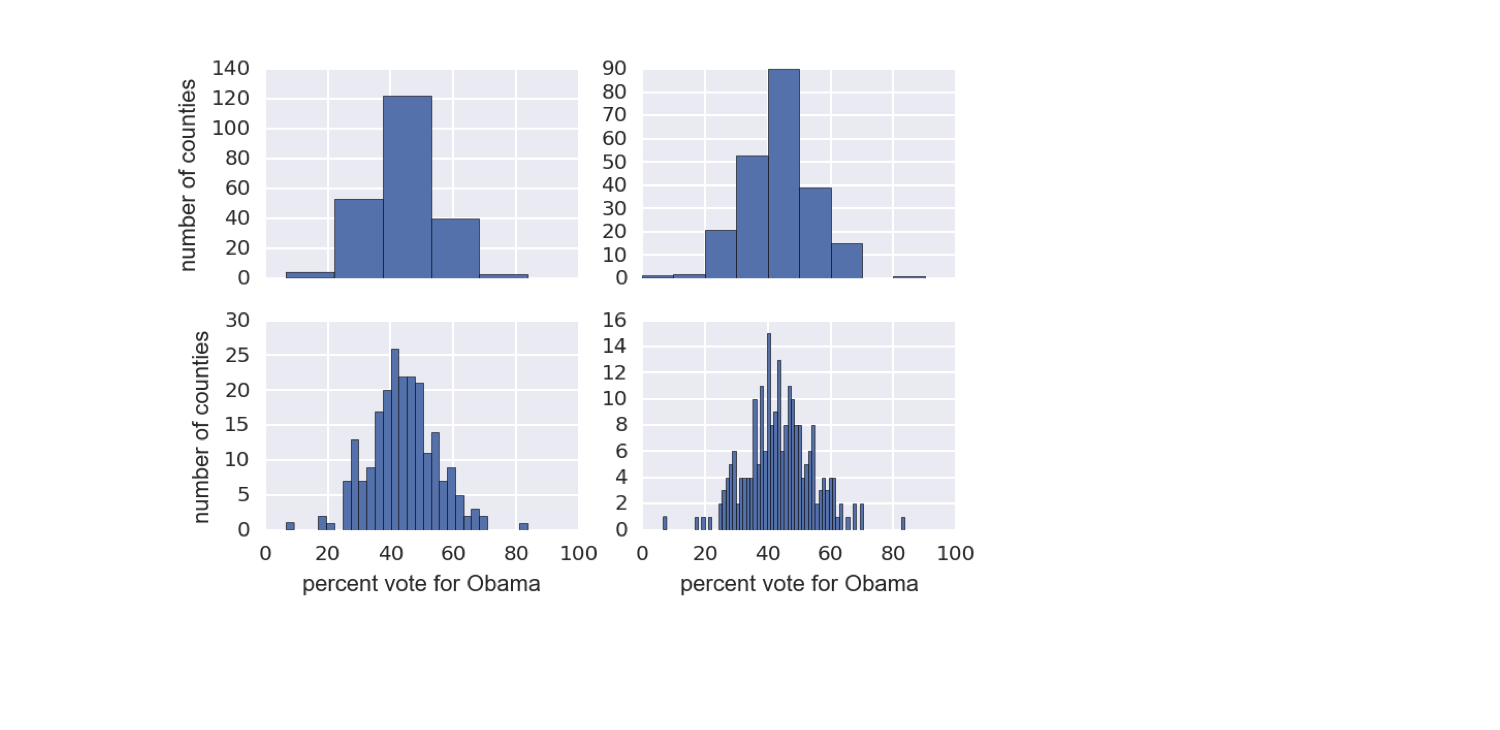
Hasil pemilu 2008 AS di swing state

1 Data diambil dari Data.gov (https://www.data.gov/)

