Memplot histogram
Berpikir Statistis dengan Python (Bagian 1)

Justin Bois
Teaching Professor at the California Institute of Technology
Hasil pemilu negara swing AS 2008
Data diambil dari Data.gov (https://www.data.gov/)
Hasil pemilu negara swing AS 2008
Data diambil dari Data.gov (https://www.data.gov/)
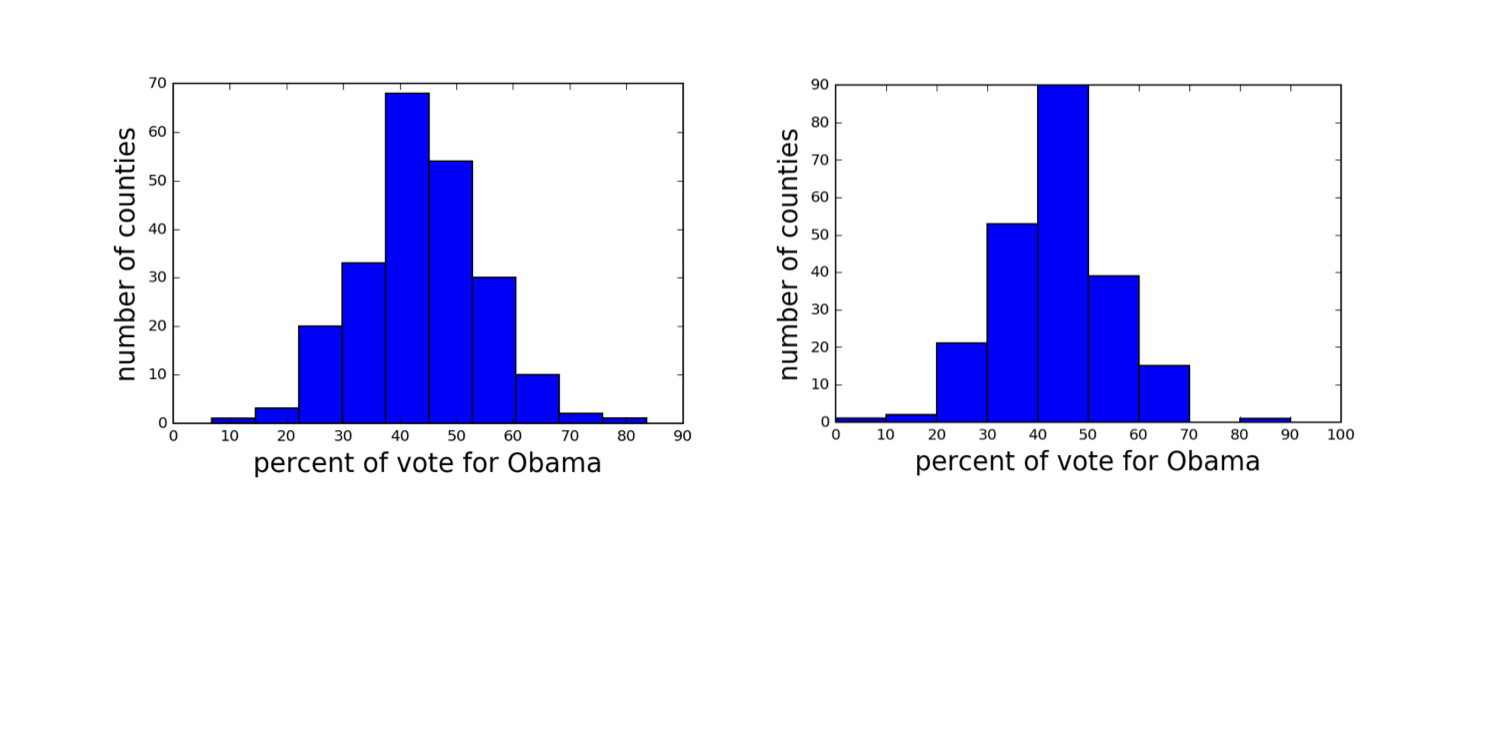
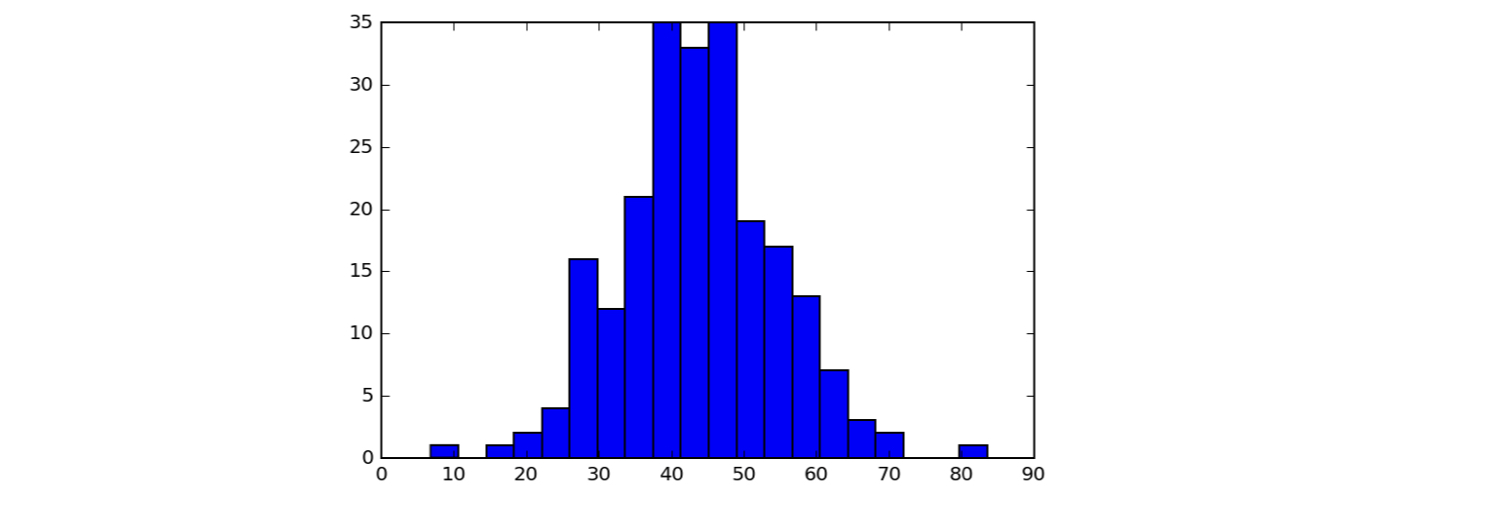
Histogram dengan binning berbeda
Data diambil dari Data.gov (https://www.data.gov/)
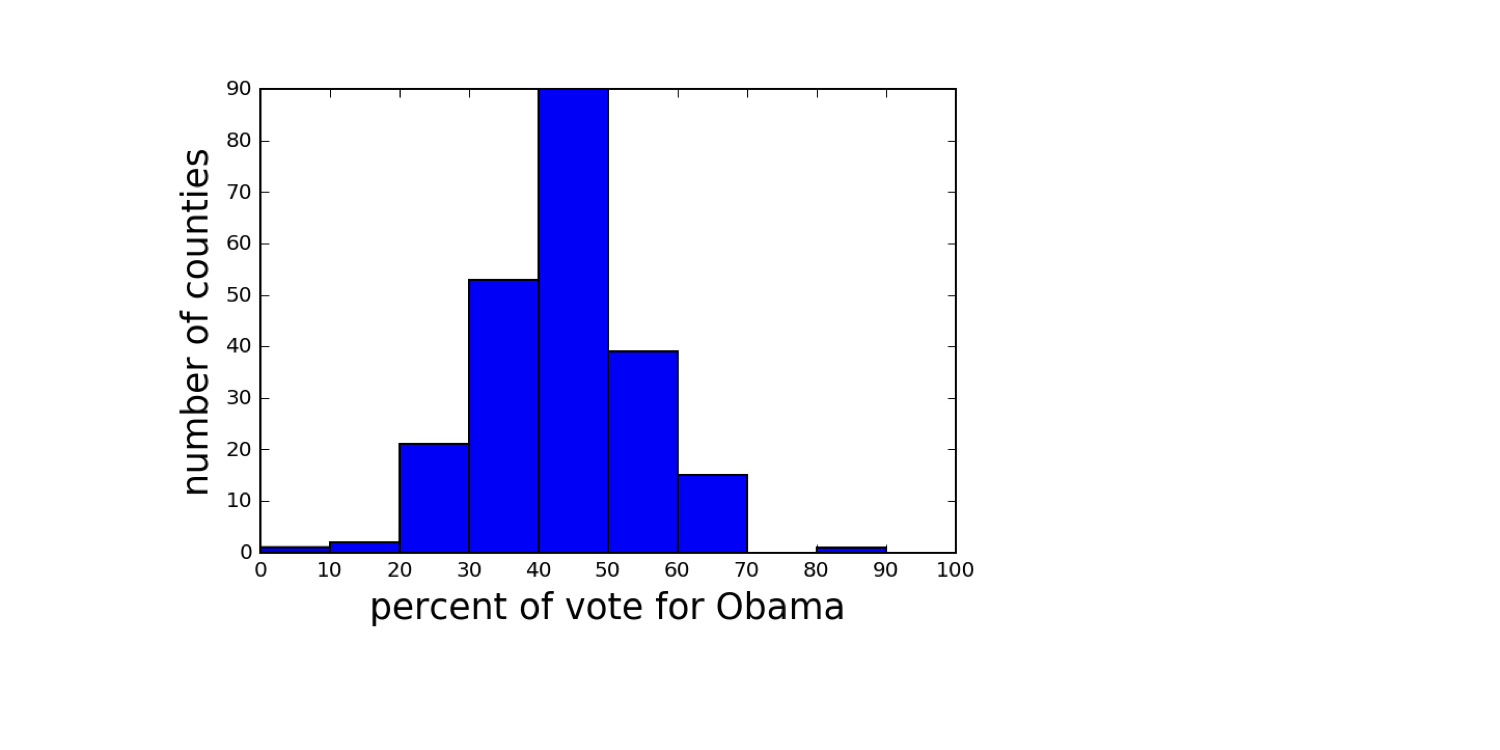
Mengatur bin histogram
bin_edges = [0, 10, 20, 30, 40, 50,
                60, 70, 80, 90, 100]
_ = plt.hist(df_swing['dem_share'], bins=bin_edges)
plt.show()
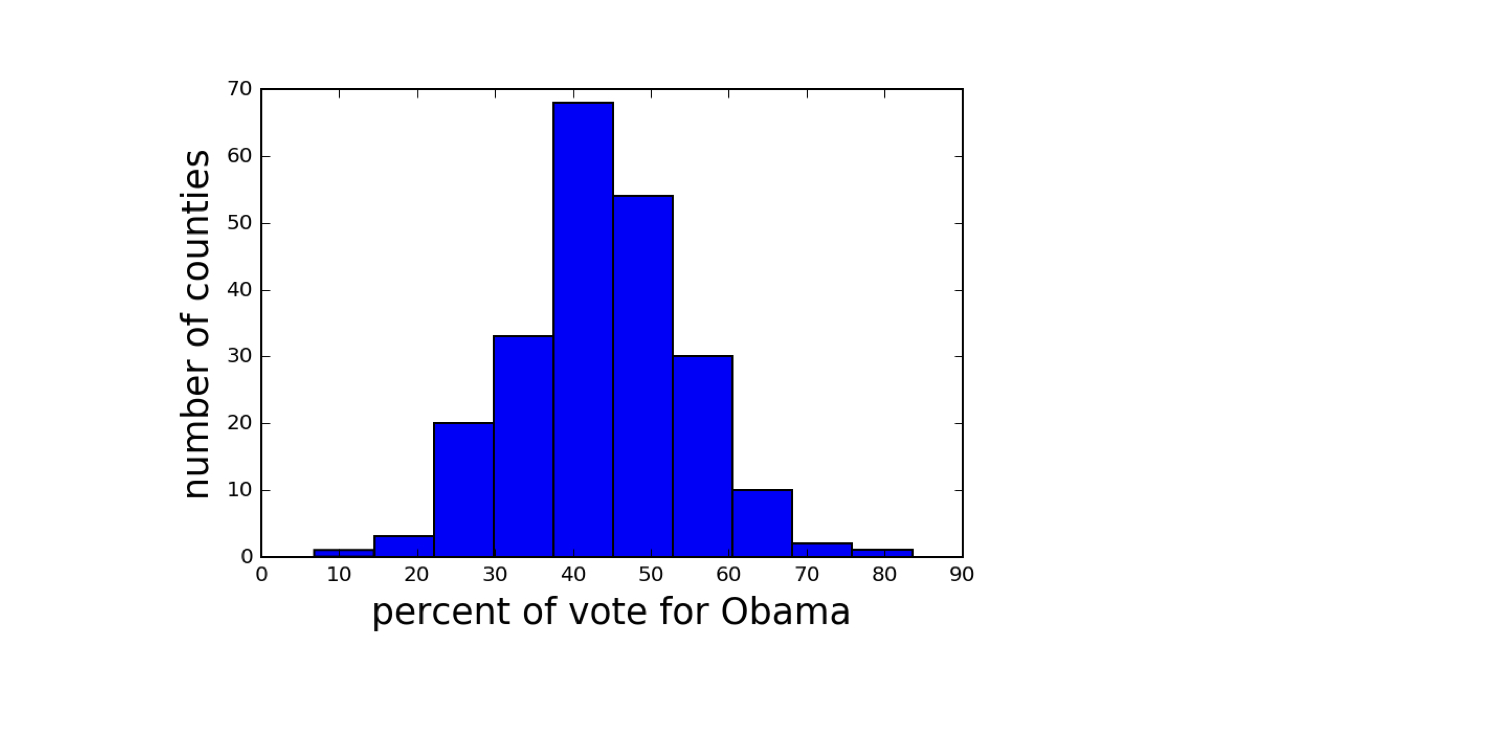
Mengatur bin histogram
_ = plt.hist(df_swing['dem_share'], bins=20)
plt.show()
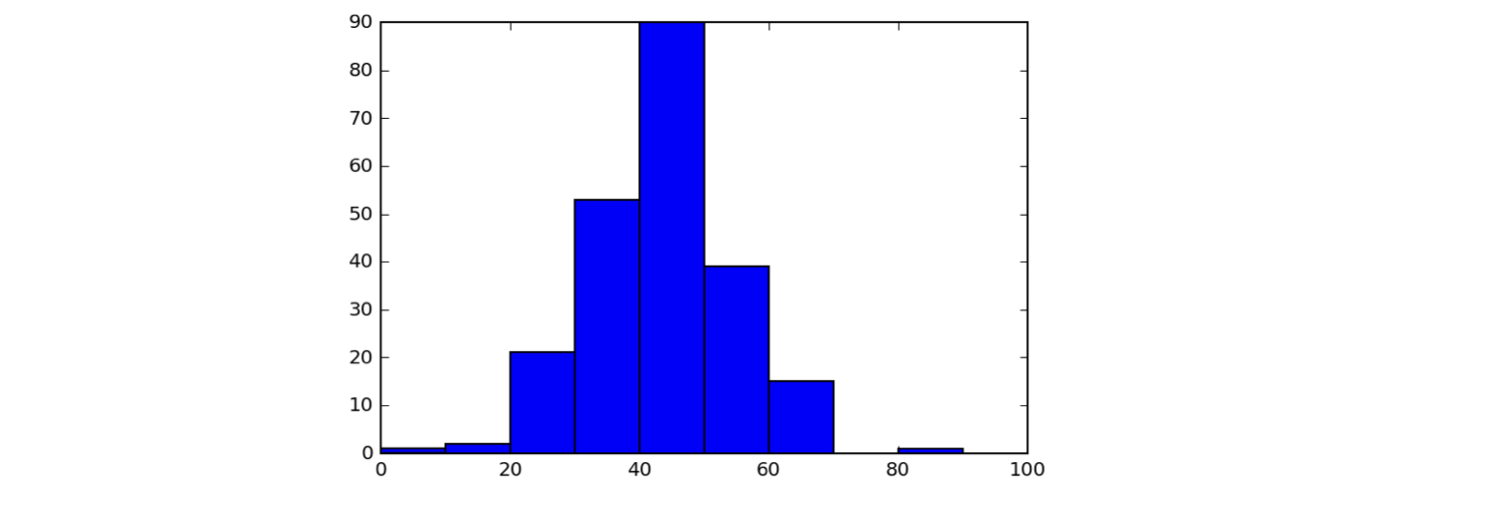
Histogram bergaya Seaborn
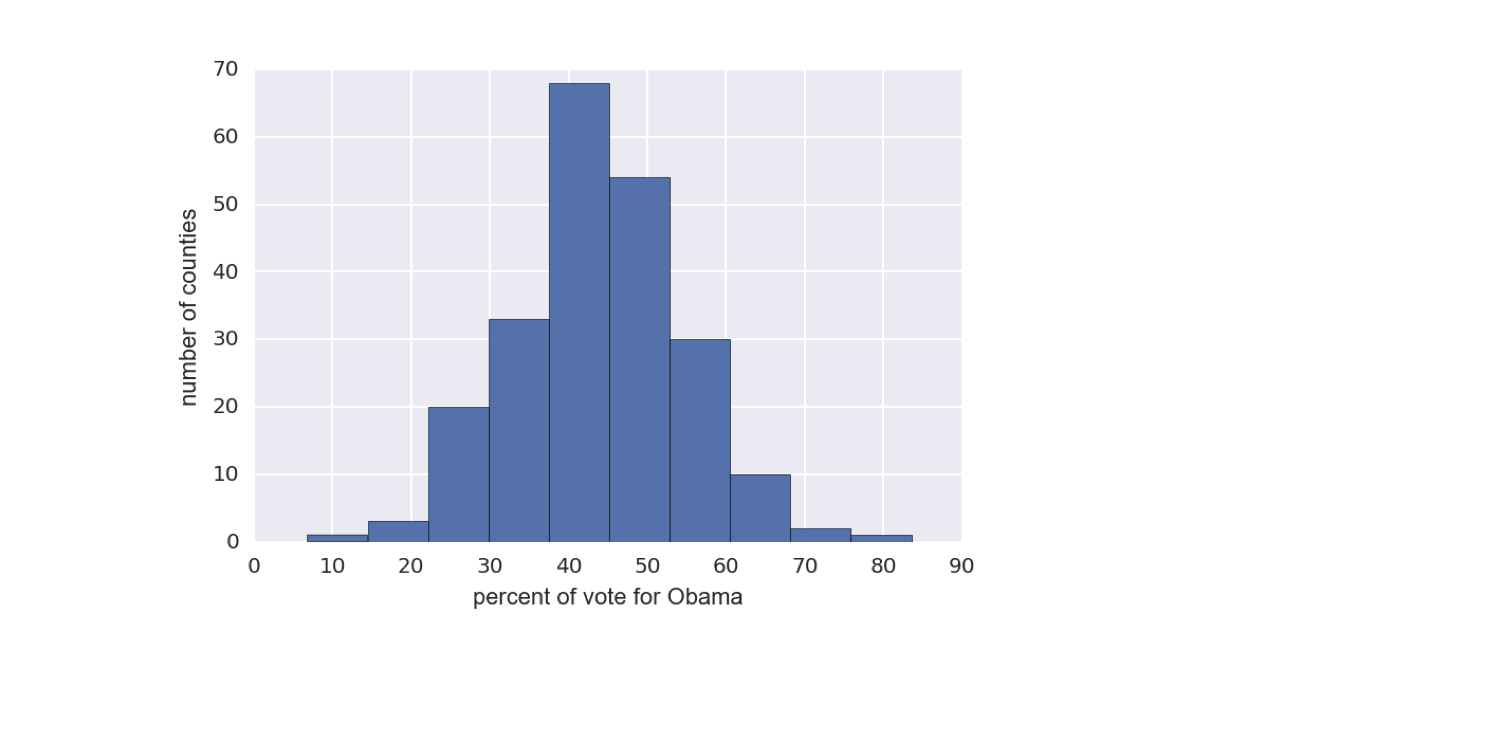
1 Data diambil dari Data.gov (https://www.data.gov/)

