MA sebagai indikator tren
Perdagangan Finansial dengan Python

Chelsea Yang
Data Science Instructor
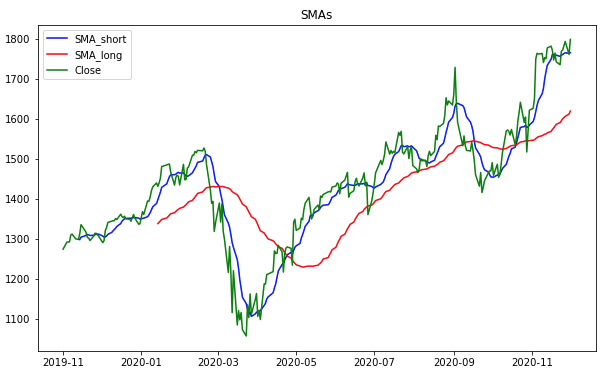
Memplot SMA
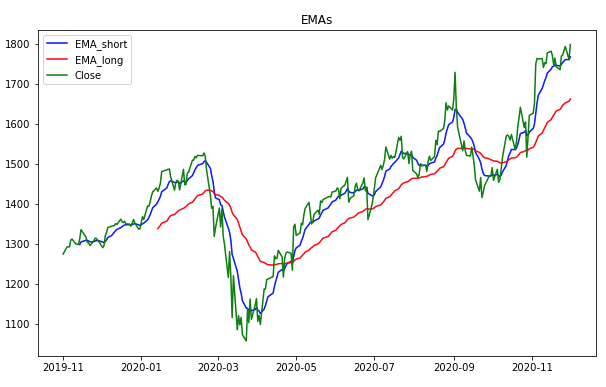
Memplot EMA
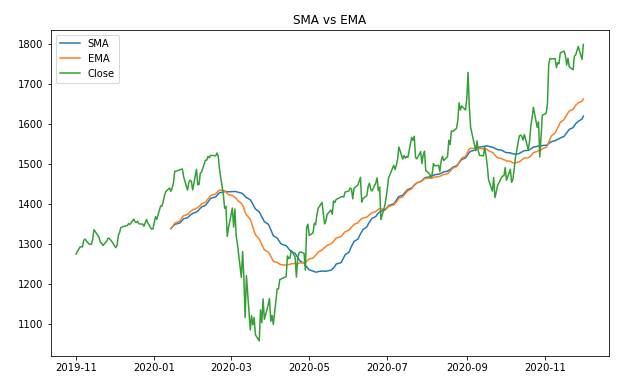
SMA vs EMA
EMA lebih peka terhadap pergerakan harga terbaru
Perdagangan Finansial dengan Python
Chelsea Yang
Data Science Instructor
EMA lebih peka terhadap pergerakan harga terbaru

