Menjelajah dan memvisualisasikan data spasial dan atributnya

Bekerja dengan Data Geospasial di Python

Joris Van den Bossche

Open source software developer and teacher, GeoPandas maintainer
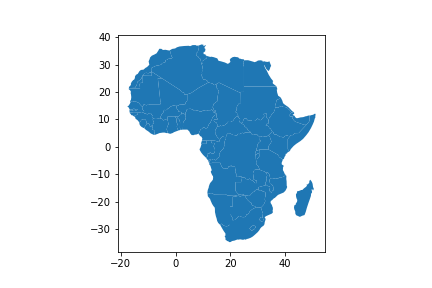
Memfilter data

countries.head()
          name      continent       gdp                            geometry
0  Afghanistan           Asia   64080.0  POLYGON ((61.21 35.65, 62.23 35...
1       Angola         Africa  189000.0  MULTIPOLYGON (((23.90 -11.72, 2...
...
countries['continent'] == 'Africa'
0      False
1       True
         ...  
175     True
176     True
Name: continent, Length: 177, dtype: bool
Bekerja dengan Data Geospasial di Python

Memfilter data

countries_africa = countries[countries['continent'] == 'Africa']
countries_africa.plot()

Bekerja dengan Data Geospasial di Python

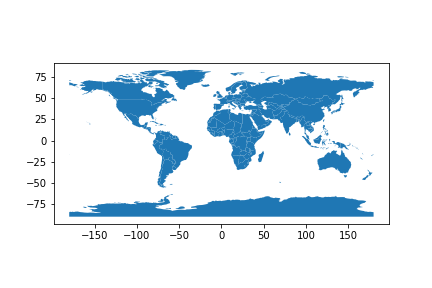
Memvisualisasikan data spasial

countries.plot()

Bekerja dengan Data Geospasial di Python

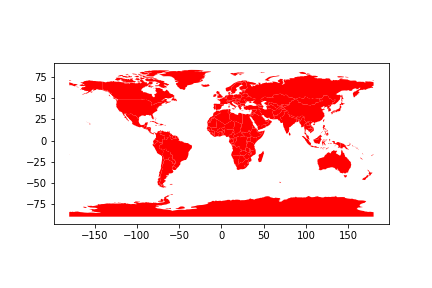
Mengatur warna: seragam

countries.plot(color="red")

Bekerja dengan Data Geospasial di Python

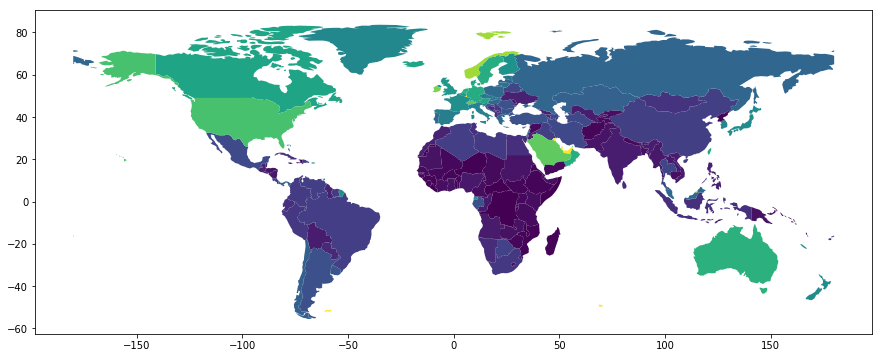
Mengatur warna: berdasarkan nilai atribut

countries.plot(column='gdp_per_cap')
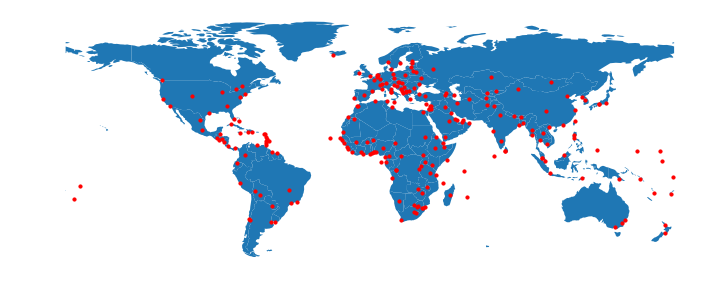
Bekerja dengan Data Geospasial di Python

Plot multilapis

fig, ax = plt.subplots(figsize=(12, 6))
countries.plot(ax=ax)
cities.plot(ax=ax, color='red', markersize=10)
ax.set_axis_off()

Bekerja dengan Data Geospasial di Python

Ayo berlatih!

Bekerja dengan Data Geospasial di Python

Preparing Video For Download...