Using PairGrid and pairplot
Visualisasi Data Lanjutan dengan Seaborn

Chris Moffitt
Instructor
Pairwise relationships
PairGridshows pairwise relationships between data elements

Creating a PairGrid
- The
PairGridfollows similar API to FacetGrid
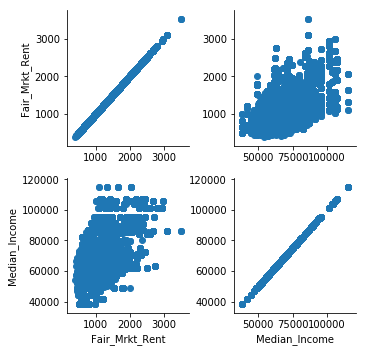
g = sns.PairGrid(df, vars=["Fair_Mrkt_Rent","Median_Income"])
g = g.map(sns.scatterplot)
Customizing the PairGrid diagonals
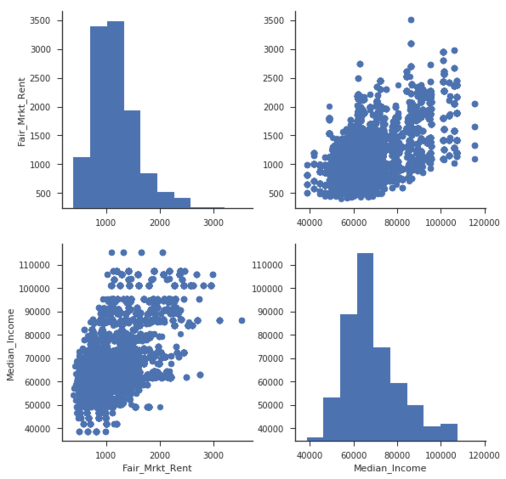
g = sns.PairGrid(df, vars=["Fair_Mrkt_Rent", "Median_Income"])
g = g.map_diag(sns.histplot)
g = g.map_offdiag(sns.scatterplot)
Pairplot
pairplotis a shortcut for thePairGrid
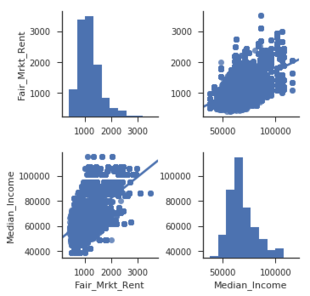
sns.pairplot(df, vars=["Fair_Mrkt_Rent","Median_Income"], kind="reg",
             diag_kind="hist")
Customizing a pairplot
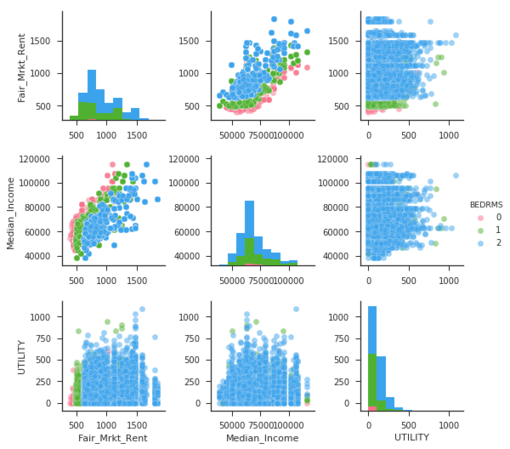
sns.pairplot(df.query("BEDRMS < 3"),
             vars=["Fair_Mrkt_Rent",
             "Median_Income", "UTILITY"],
             hue="BEDRMS", palette="husl",
             plot_kws={"alpha": 0.5})