Dekomposisi Deret Waktu untuk Deteksi Outlier
Deteksi Anomali dengan Python

Bekhruz (Bex) Tuychiev
Kaggle Master, Data Science Content Creator
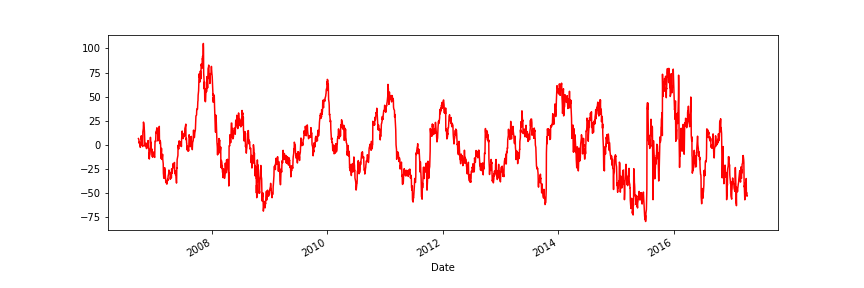
Musiman
Memplot musiman
results.seasonal.plot(color="red", figsize=(12, 4))
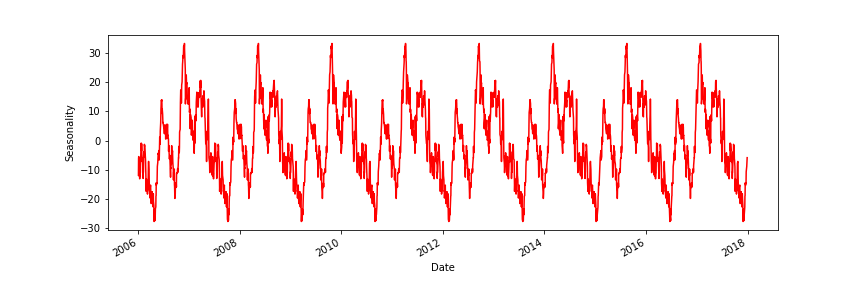
Contoh musiman
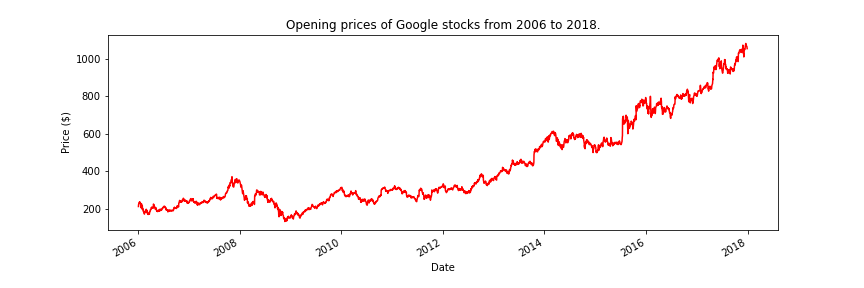
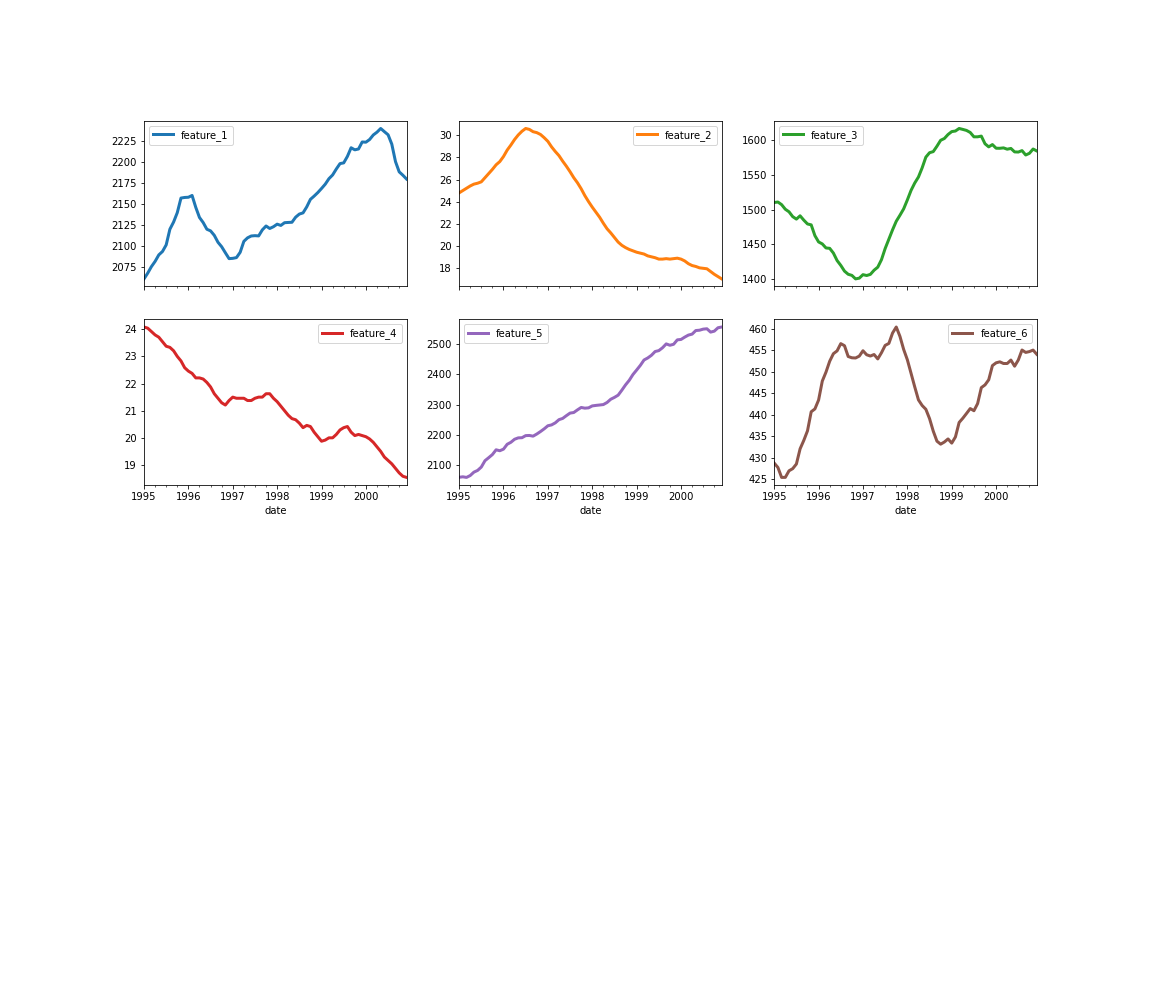
Plot awal saham
Tren
results.trend.plot(color="red", figsize=(12, 4))

Contoh tren
Residual
results.resid.plot(color="red", figsize=(12, 4))
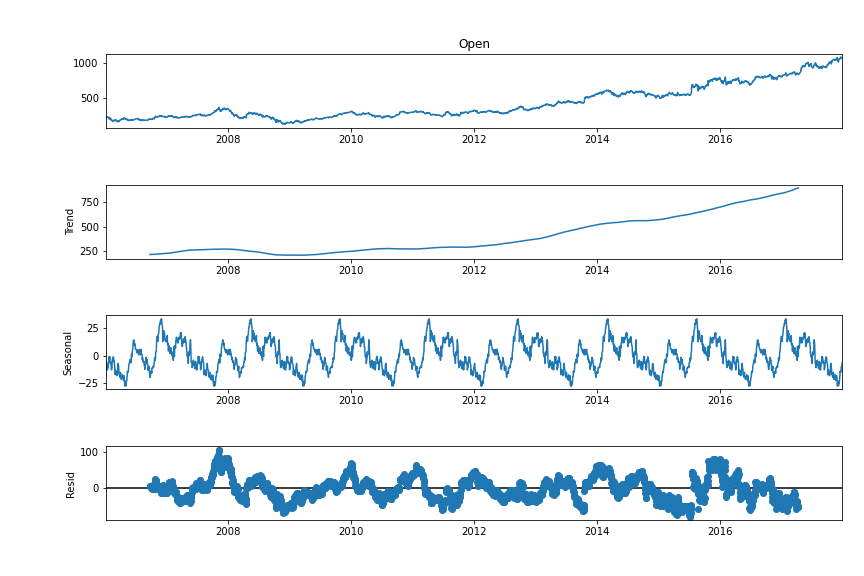
Dekomposisi