Memvisualisasikan kinerja model
Pemodelan dengan tidymodels di R

David Svancer
Data Scientist
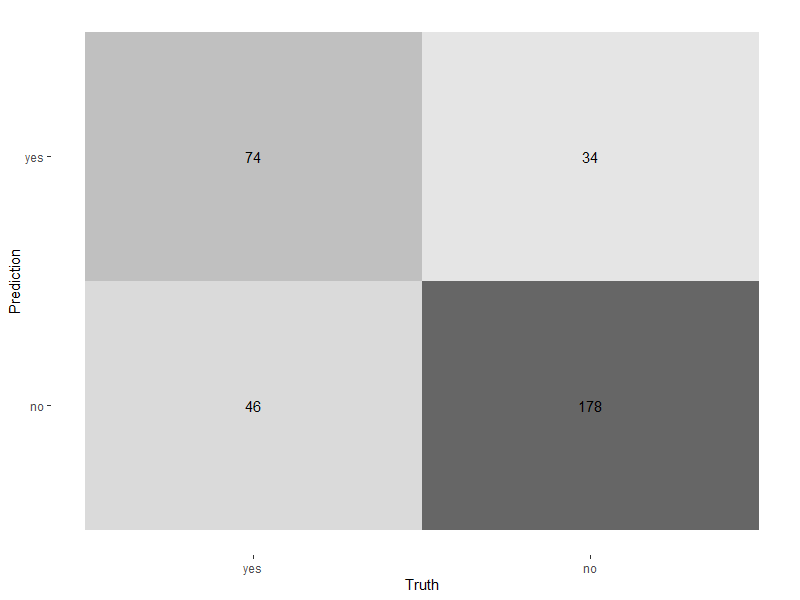
Memplot confusion matrix
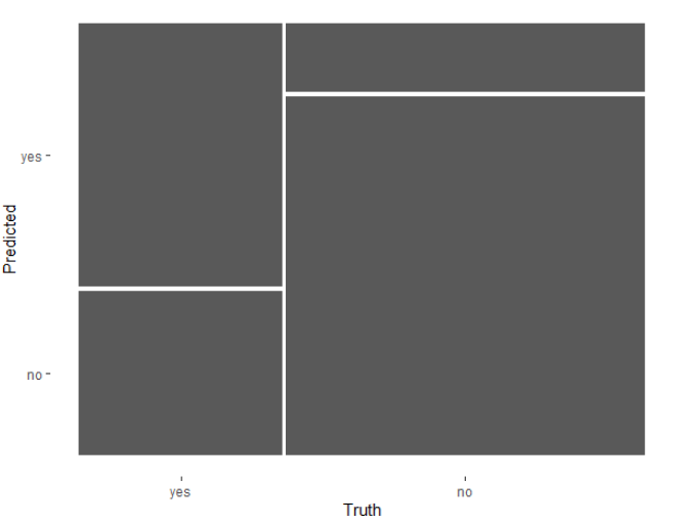
Plot mosaik
Plot mosaik
Memvisualisasikan kinerja lintas ambang
Memvisualisasikan kinerja lintas ambang
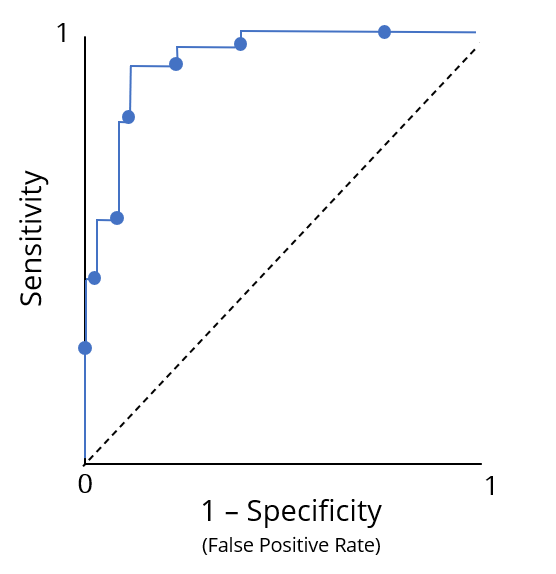
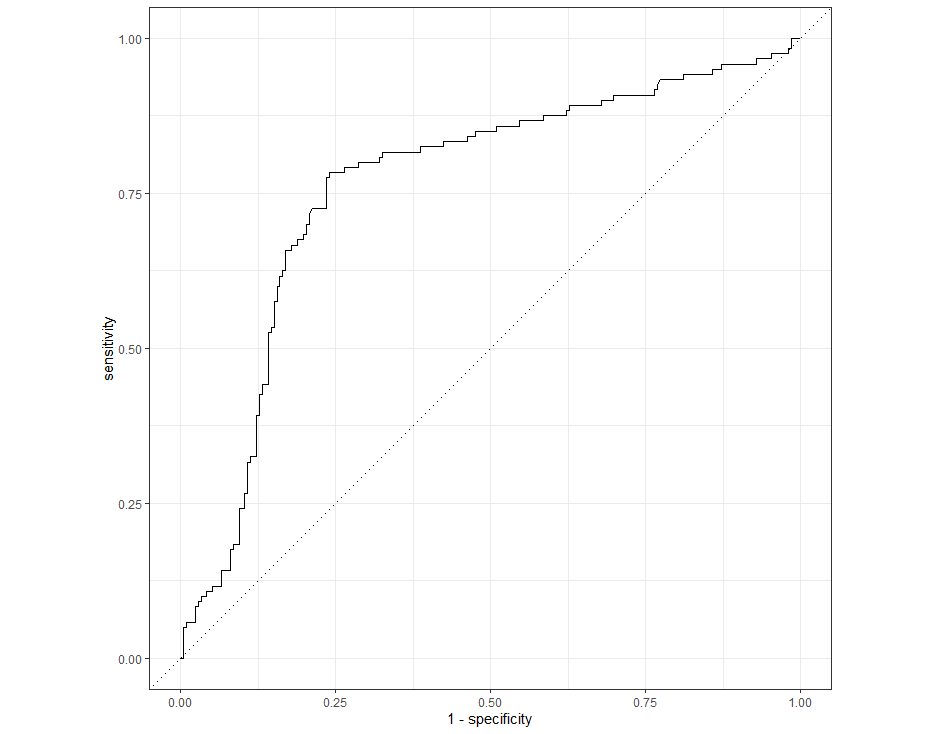
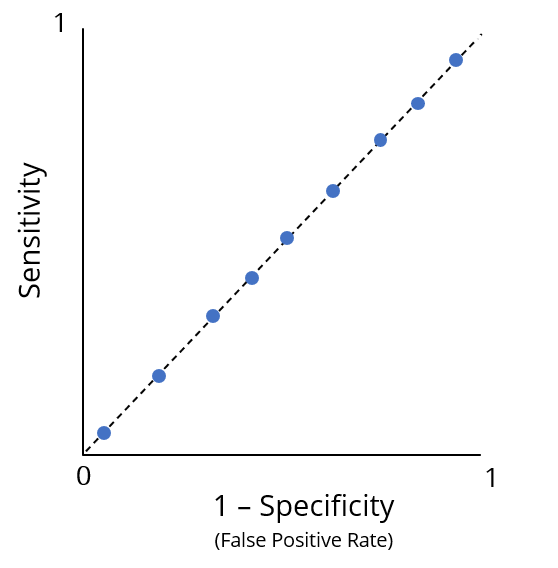
Kurva ROC
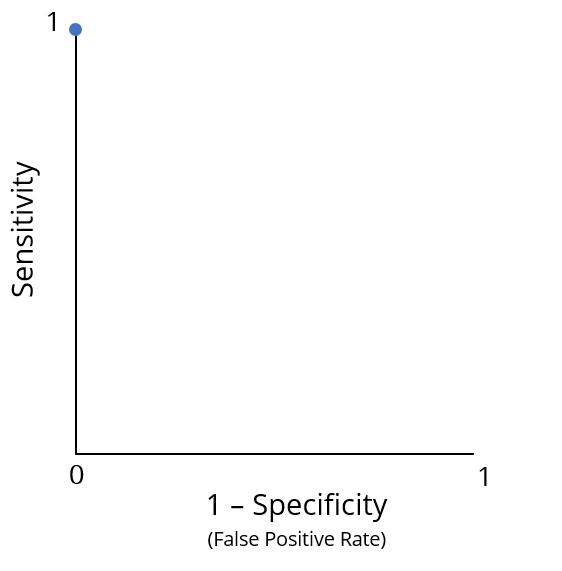
Kurva ROC
Meringkas kurva ROC
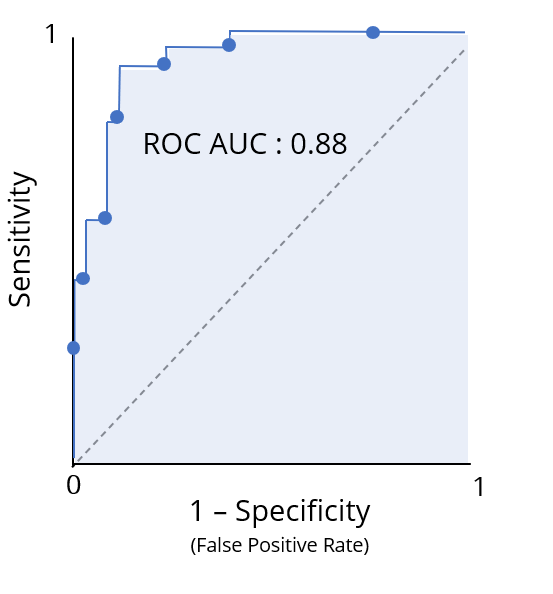
Memplot kurva ROC