Visualisasi grafis di R dengan ggplot2
R untuk Pengguna SAS

Melinda Higgins, PhD
Research Professor/Senior Biostatistician Emory University
Paket ggplot2
ggplot2adalah paket grafis yang kuat untuk R- "GG" pada
ggplotberarti "grammar of graphics" ggplot2membangun grafik dengan pendekatan berlapis- Satu atau lebih objek geometri ditambahkan ke layer dasar
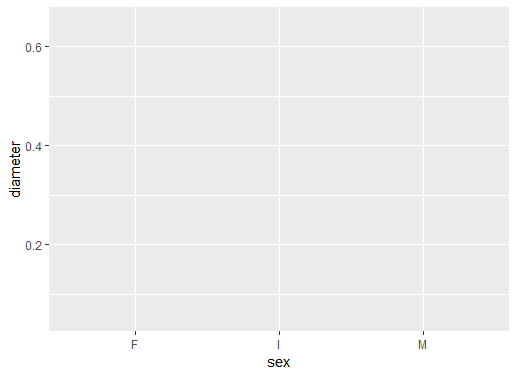
Layer - layer dasar
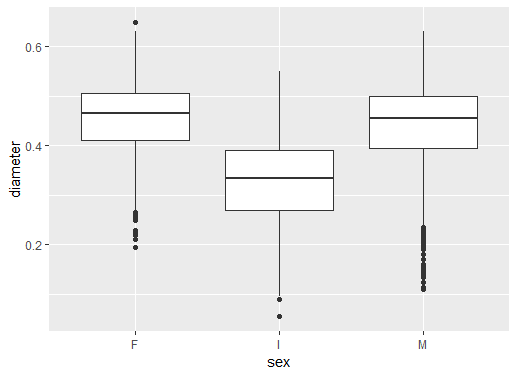
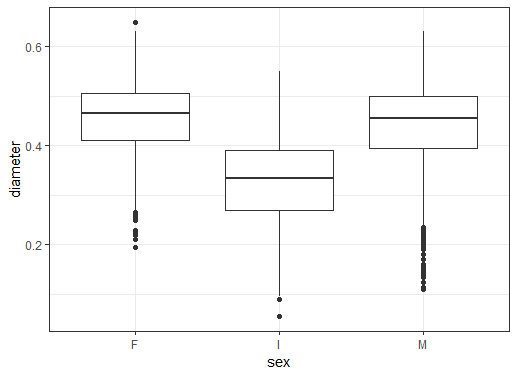
Layer - tambah geom boxplot
Layer - tambah tema
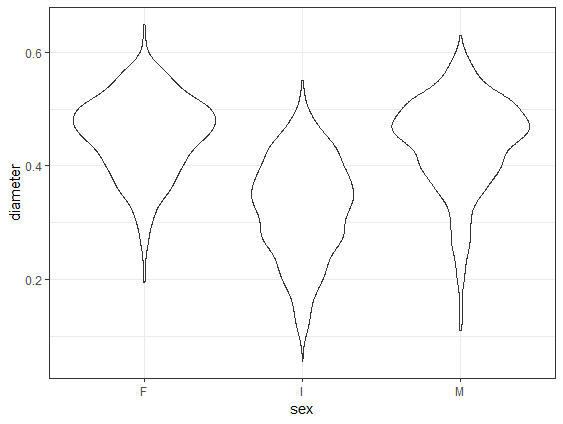
Ganti geom boxplot ke geom violin
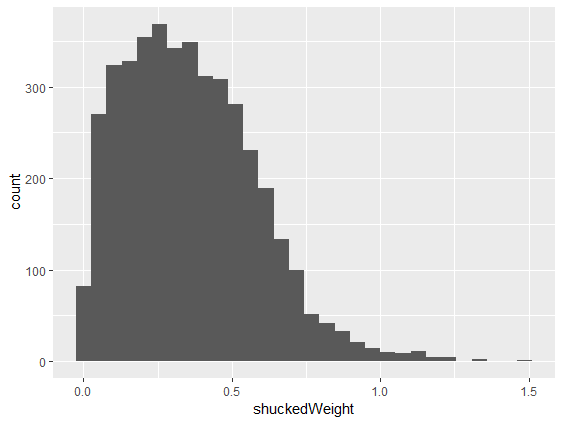
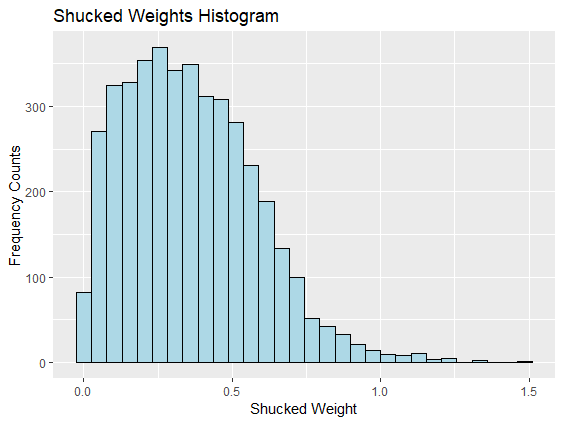
Histogram satu variabel
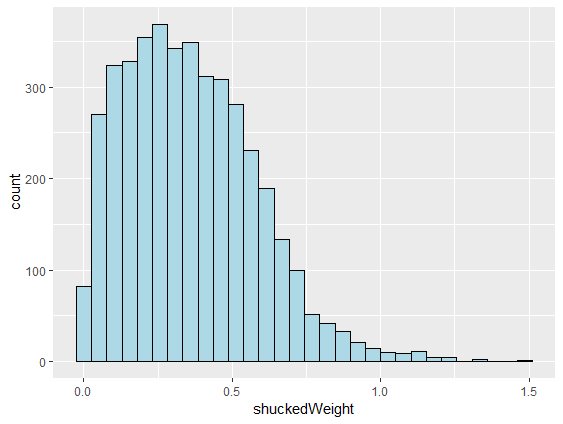
Histogram: tambah warna
Histogram: tambah judul dan label sumbu
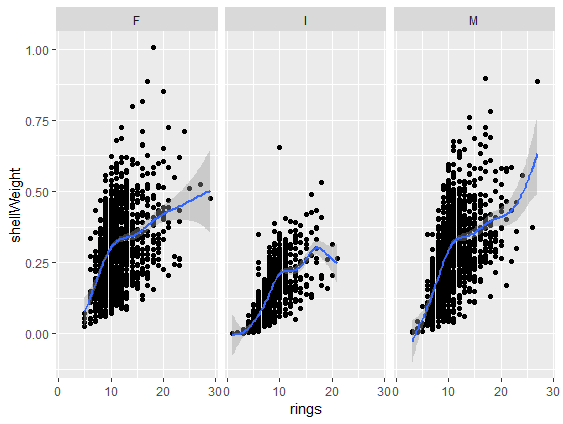
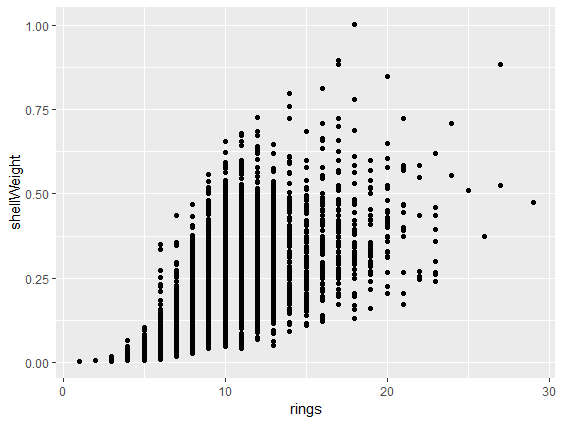
Buat scatterplot
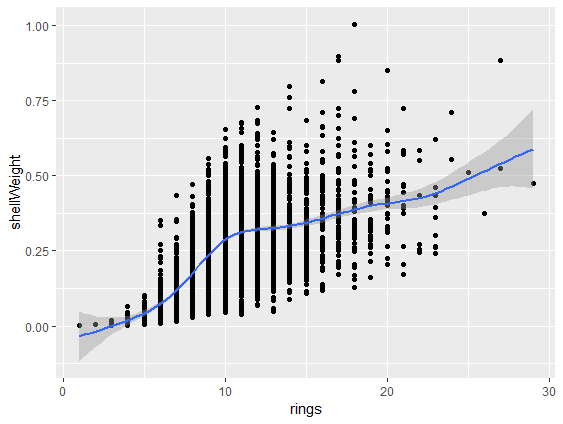
Scatterplot: tambah garis fit mulus
Buat panel menurut variabel lain