Fitur lanjutan untuk memperbaiki plot Anda
Studi Kasus: Membangun Aplikasi Web dengan Shiny di R

Dean Attali
Shiny Consultant
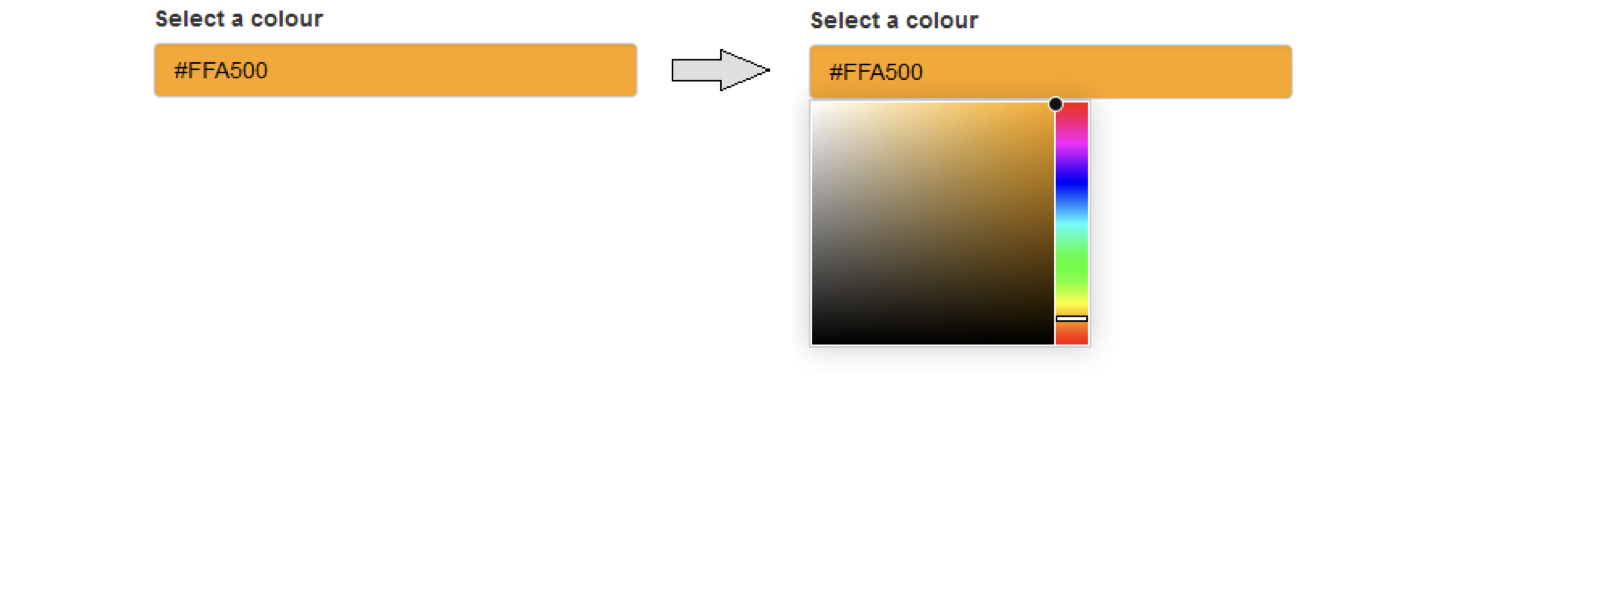
Input warna
library(colourpicker)colourInput("col", "Pilih warna", value = "orange")
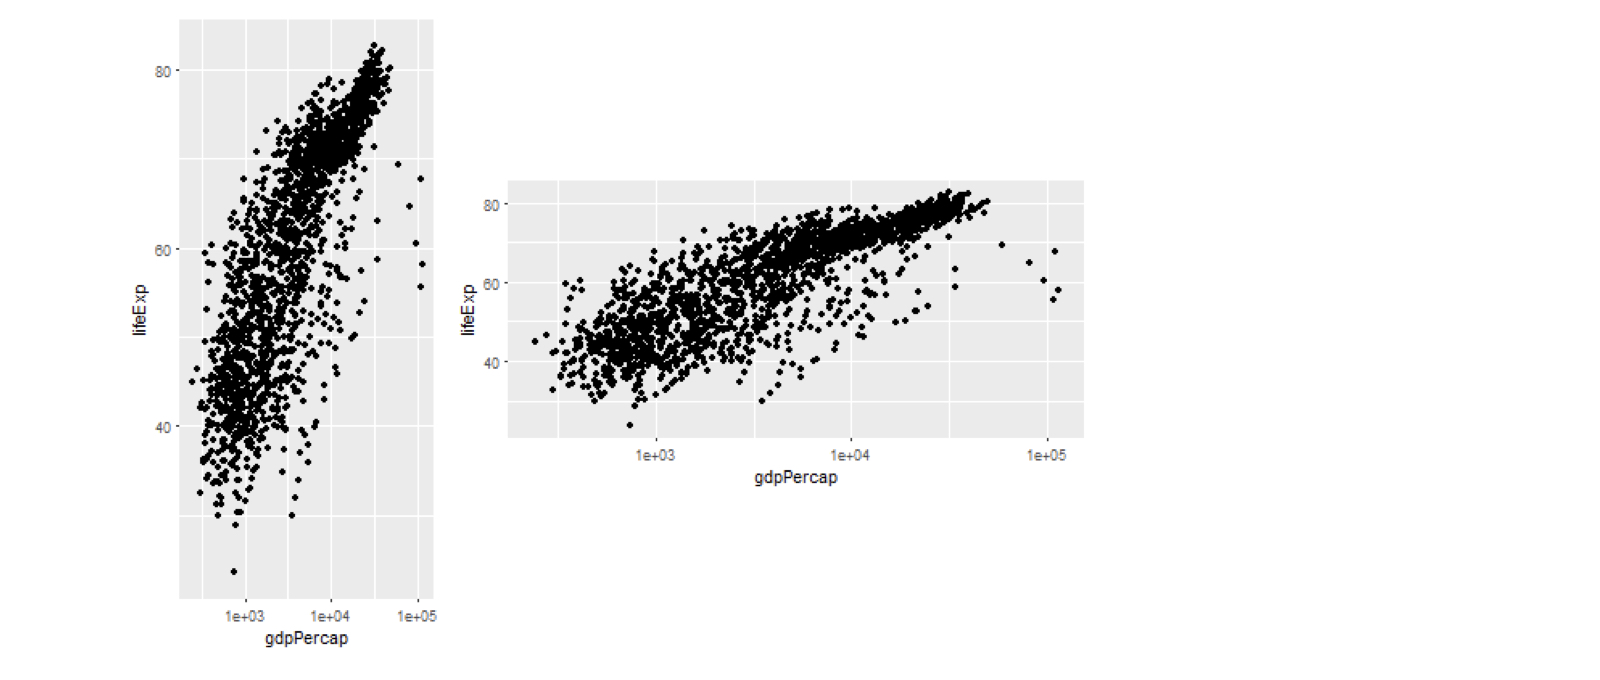
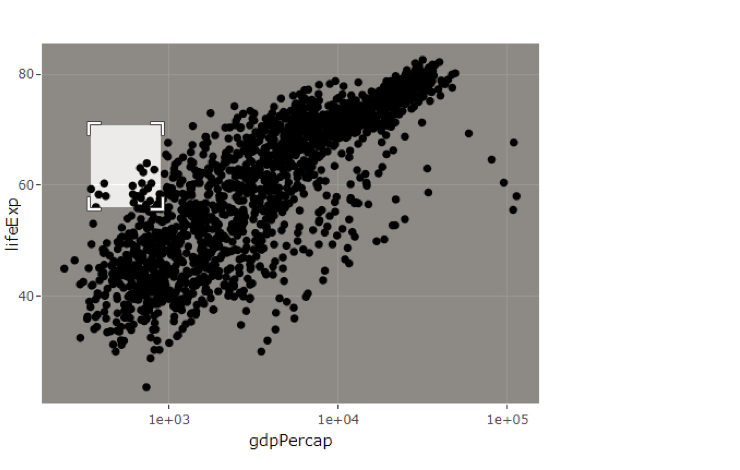
Argumen output plot
plotOutput("plot1", width = 200, height = 400)
plotOutput("plot2", width = 400, height = 200)
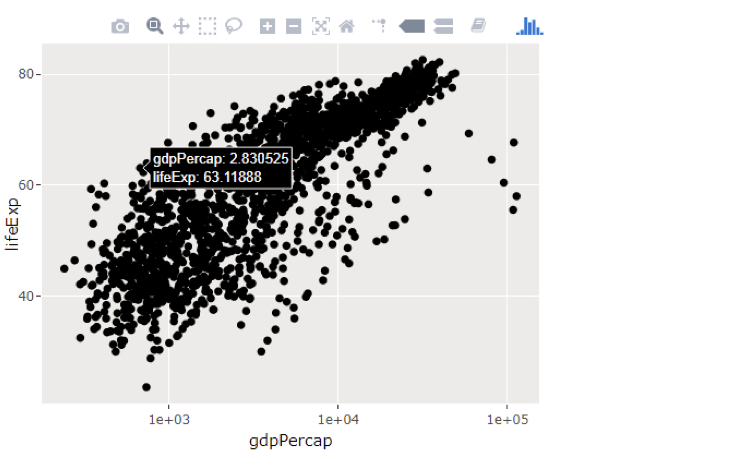
Plot interaktif dengan plotly
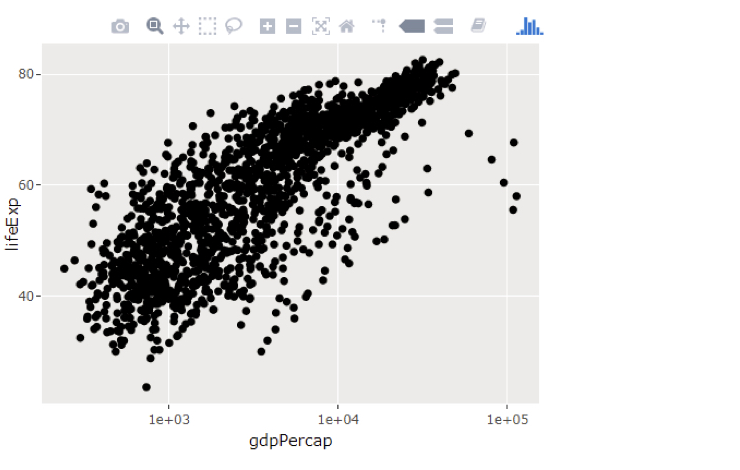
Plot interaktif dengan plotly
Plot interaktif dengan plotly
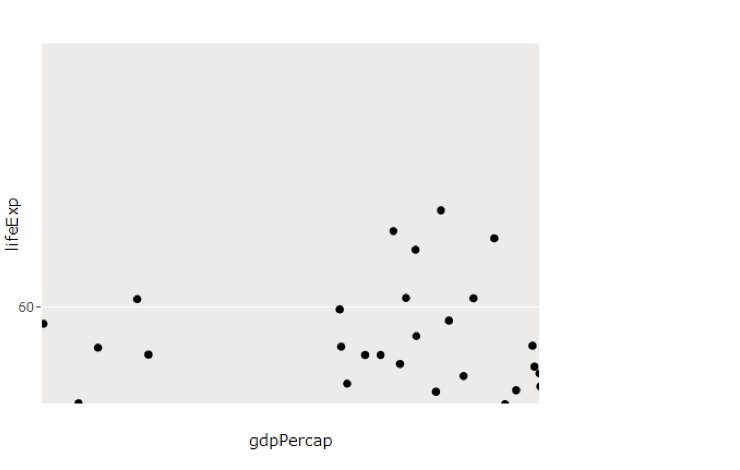
Plot interaktif dengan plotly