Menganalisis hasil optimasi
Analisis Portofolio Tingkat Menengah di R

Ross Bennett
Instructor
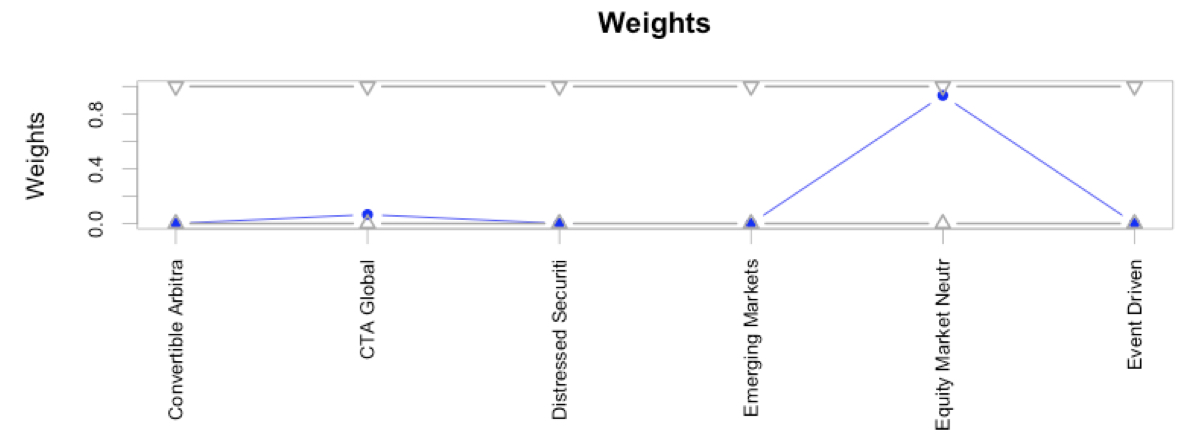
Contoh: chart bobot
# Chart the weights
chart.Weights(opt)
chart.Weights(opt_rebal)
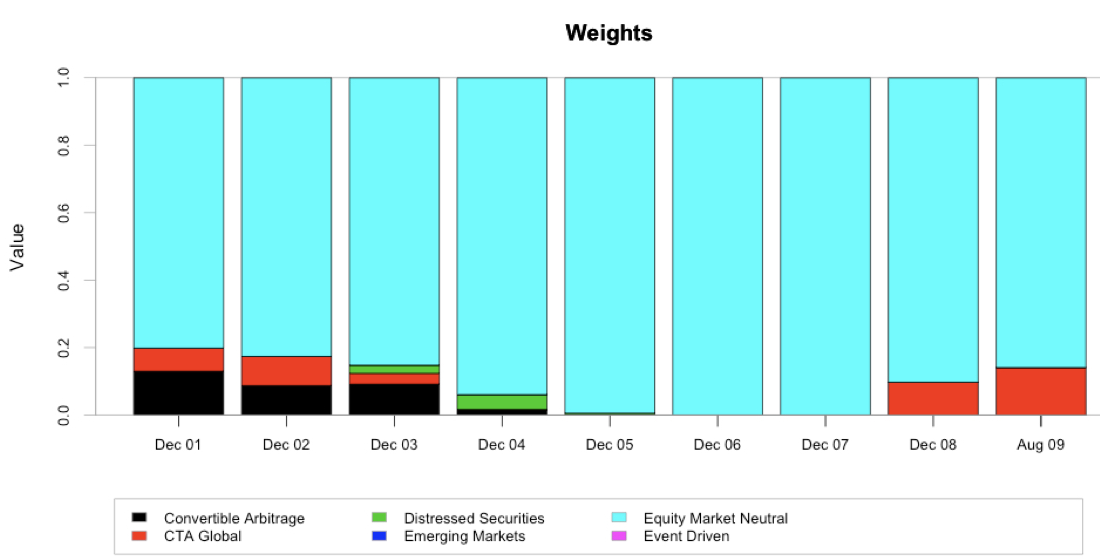
Contoh: chart bobot
# Chart the weights
chart.Weights(opt)
chart.Weights(opt_rebal)
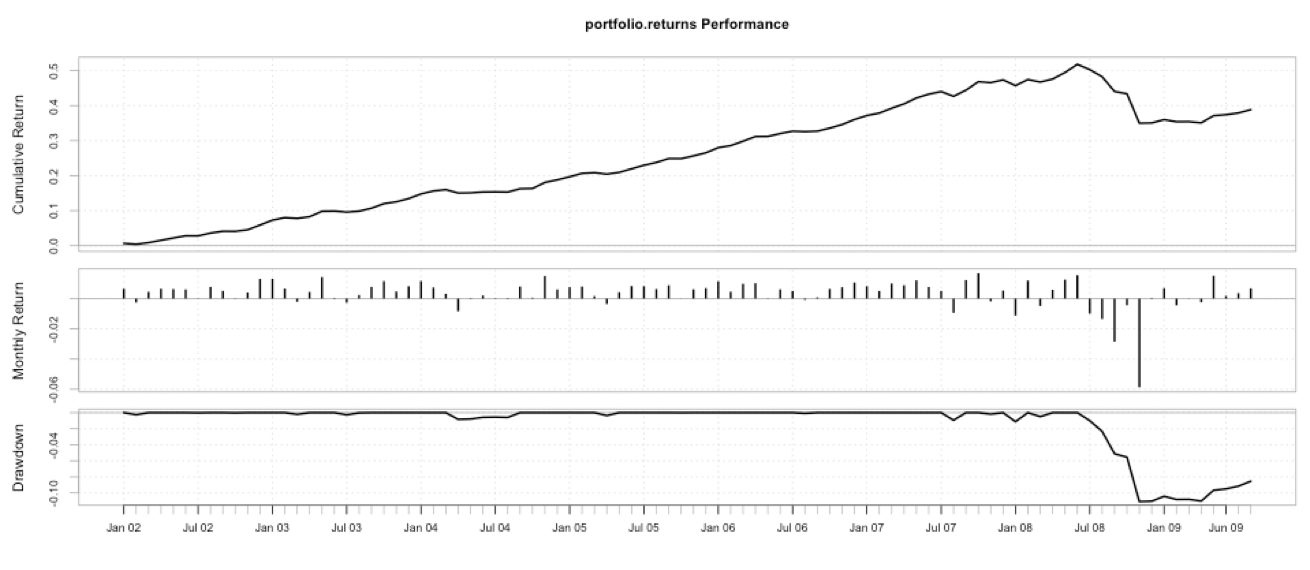
Contoh: analisis optimasi
# Compute the rebalancing returns
rr <- Return.portfolio(ret, weights = extractWeights(opt_rebal))
charts.PerformanceSummary(rr)