Memplot data dengan tigris dan ggplot2

Menganalisis Data Sensus AS di R

Kyle Walker

Instructor

Memplot data spasial dengan geom_sf()

ggplot(tx_joined) + 
  geom_sf()
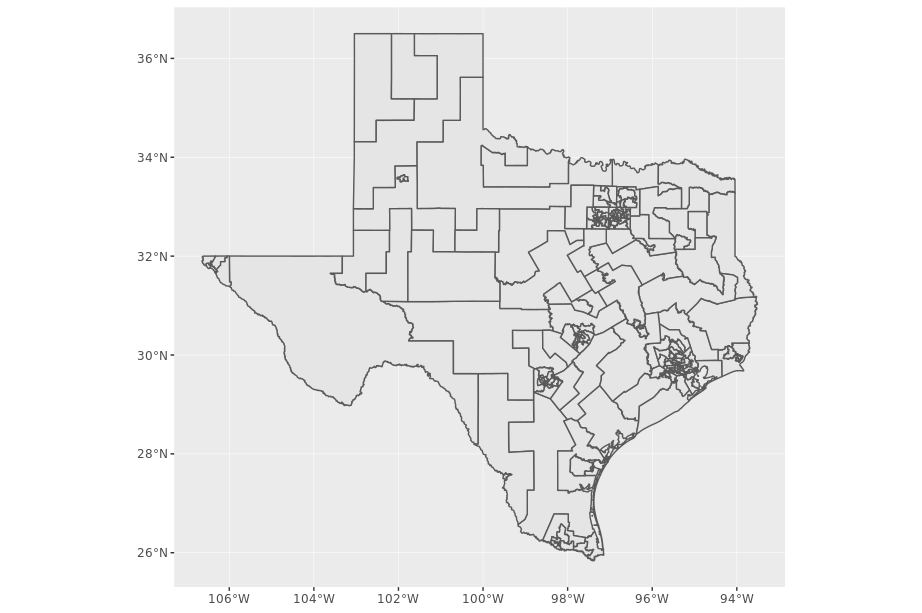
plot dengan geom_sf

Menganalisis Data Sensus AS di R

Mengatur estetika fill untuk wilayah

ggplot(tx_joined, aes(fill = Party)) + 
  geom_sf()
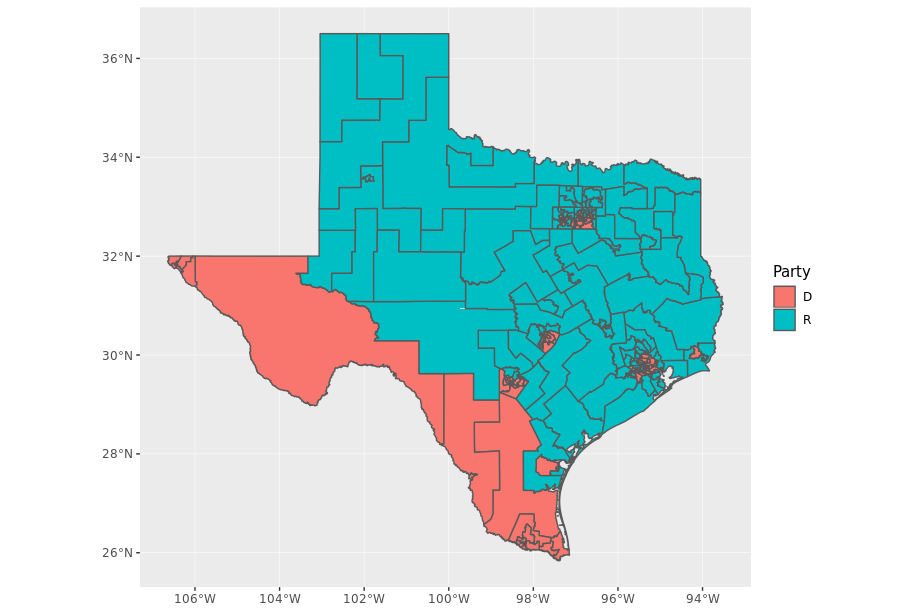
plot terisi dengan geom_sf

Menganalisis Data Sensus AS di R

Menyesuaikan warna fill

ggplot(tx_joined, aes(fill = Party)) + 
  geom_sf() + 
  scale_fill_manual(values = c("R" = "red", "D" = "blue"))
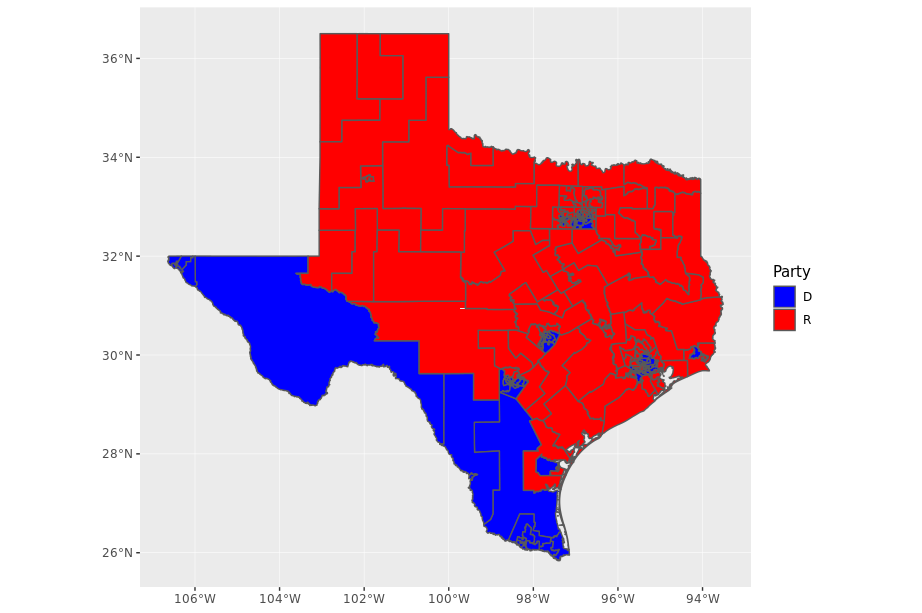
warna benar dengan geom_sf

Menganalisis Data Sensus AS di R

Memoles keluaran

ggplot(tx_joined, aes(fill = Party)) + 
  geom_sf() + 
  coord_sf(crs = 3083, datum = NA) + 
  scale_fill_manual(values = c("R" = "red", "D" = "blue")) + 
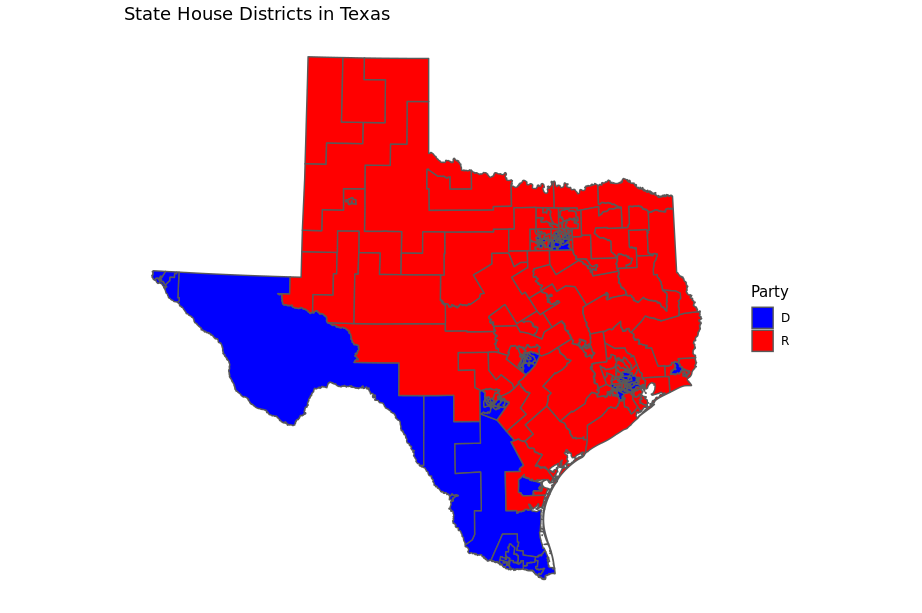
  theme_minimal() + 
  labs(title = "State House Districts in Texas")
Menganalisis Data Sensus AS di R

Plot spasial yang dipoles

Menganalisis Data Sensus AS di R

Ayo berlatih!

Menganalisis Data Sensus AS di R

Preparing Video For Download...