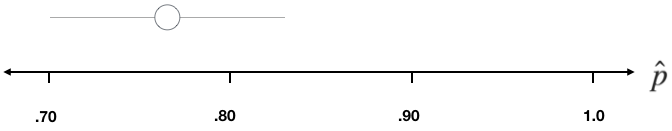
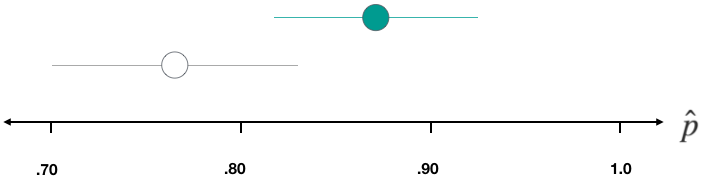
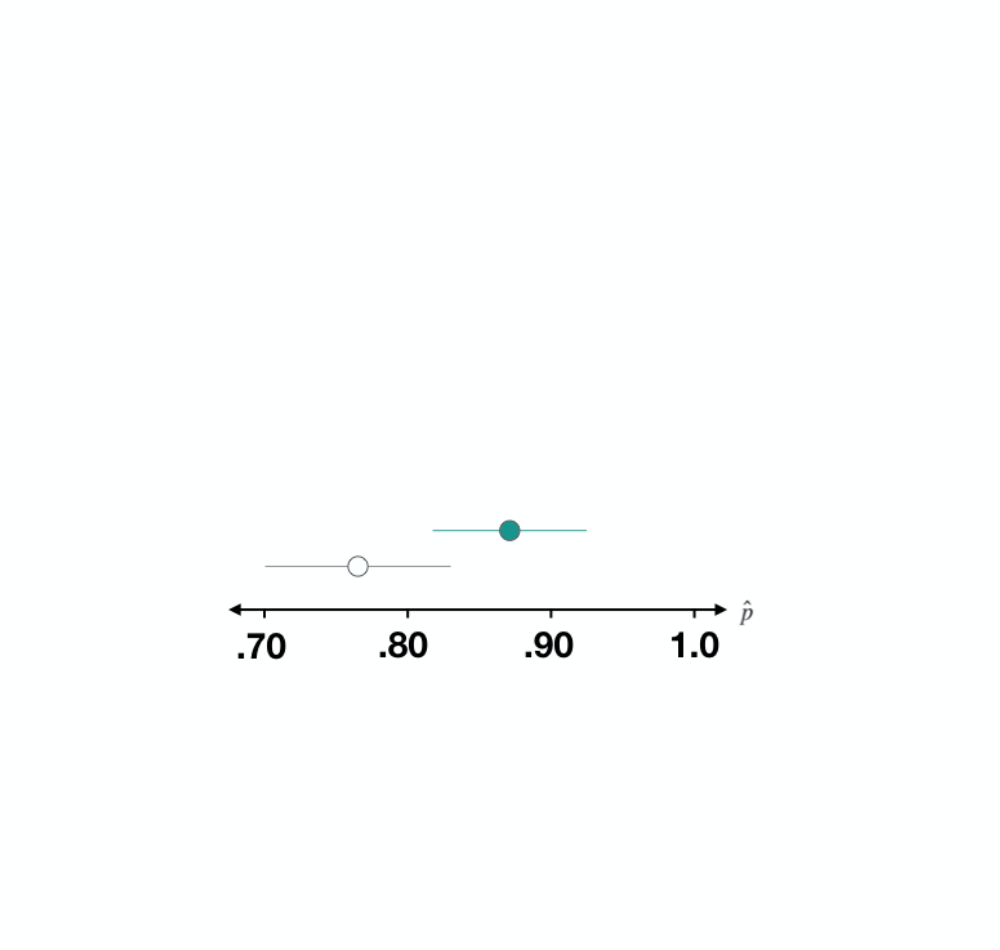
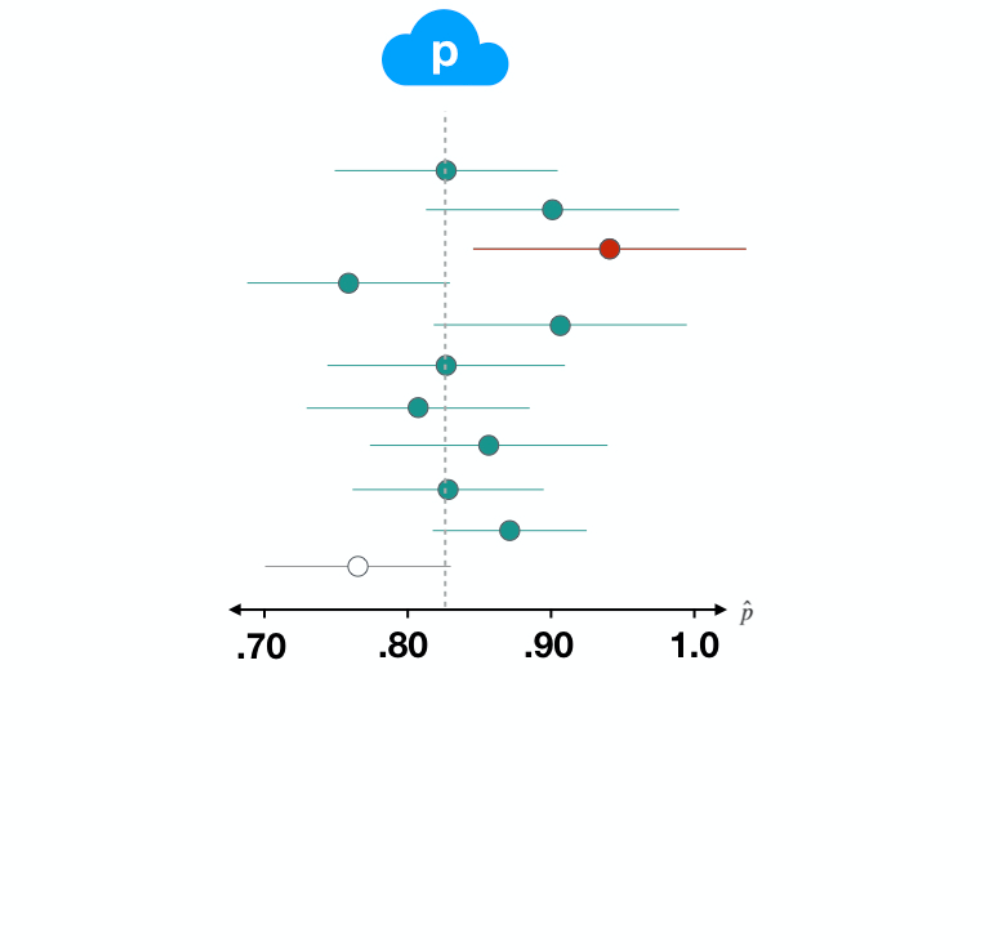
Menafsirkan Interval Kepercayaan
Inferensi untuk Data Kategorik di R

Andrew Bray
Assistant Professor of Statistics at Reed College
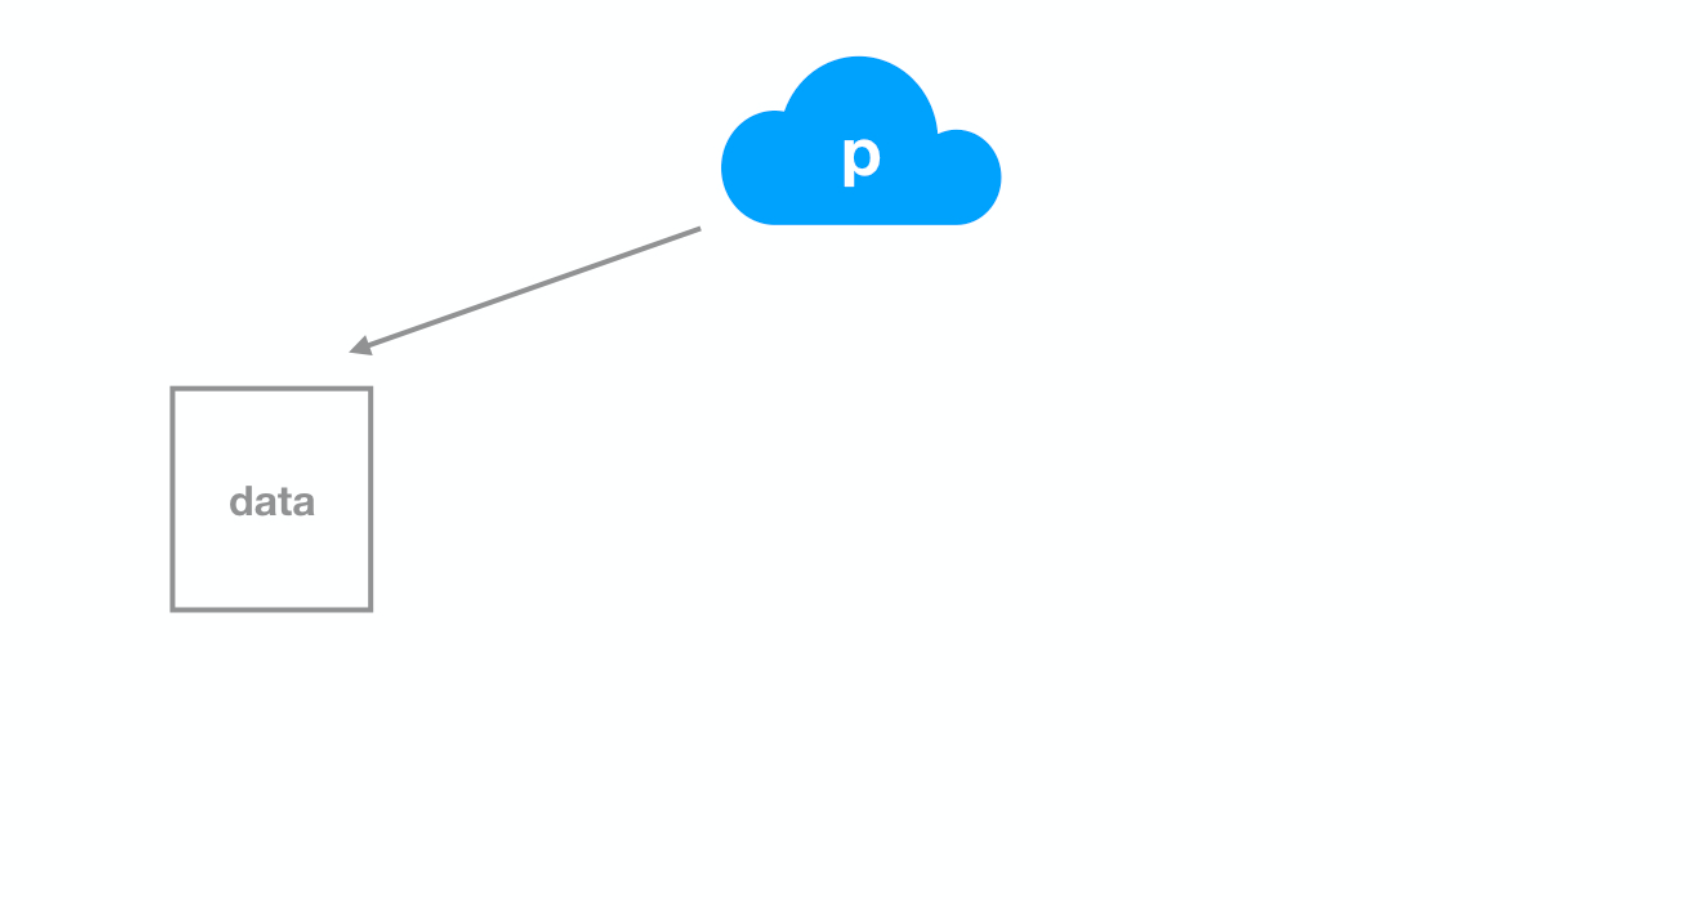
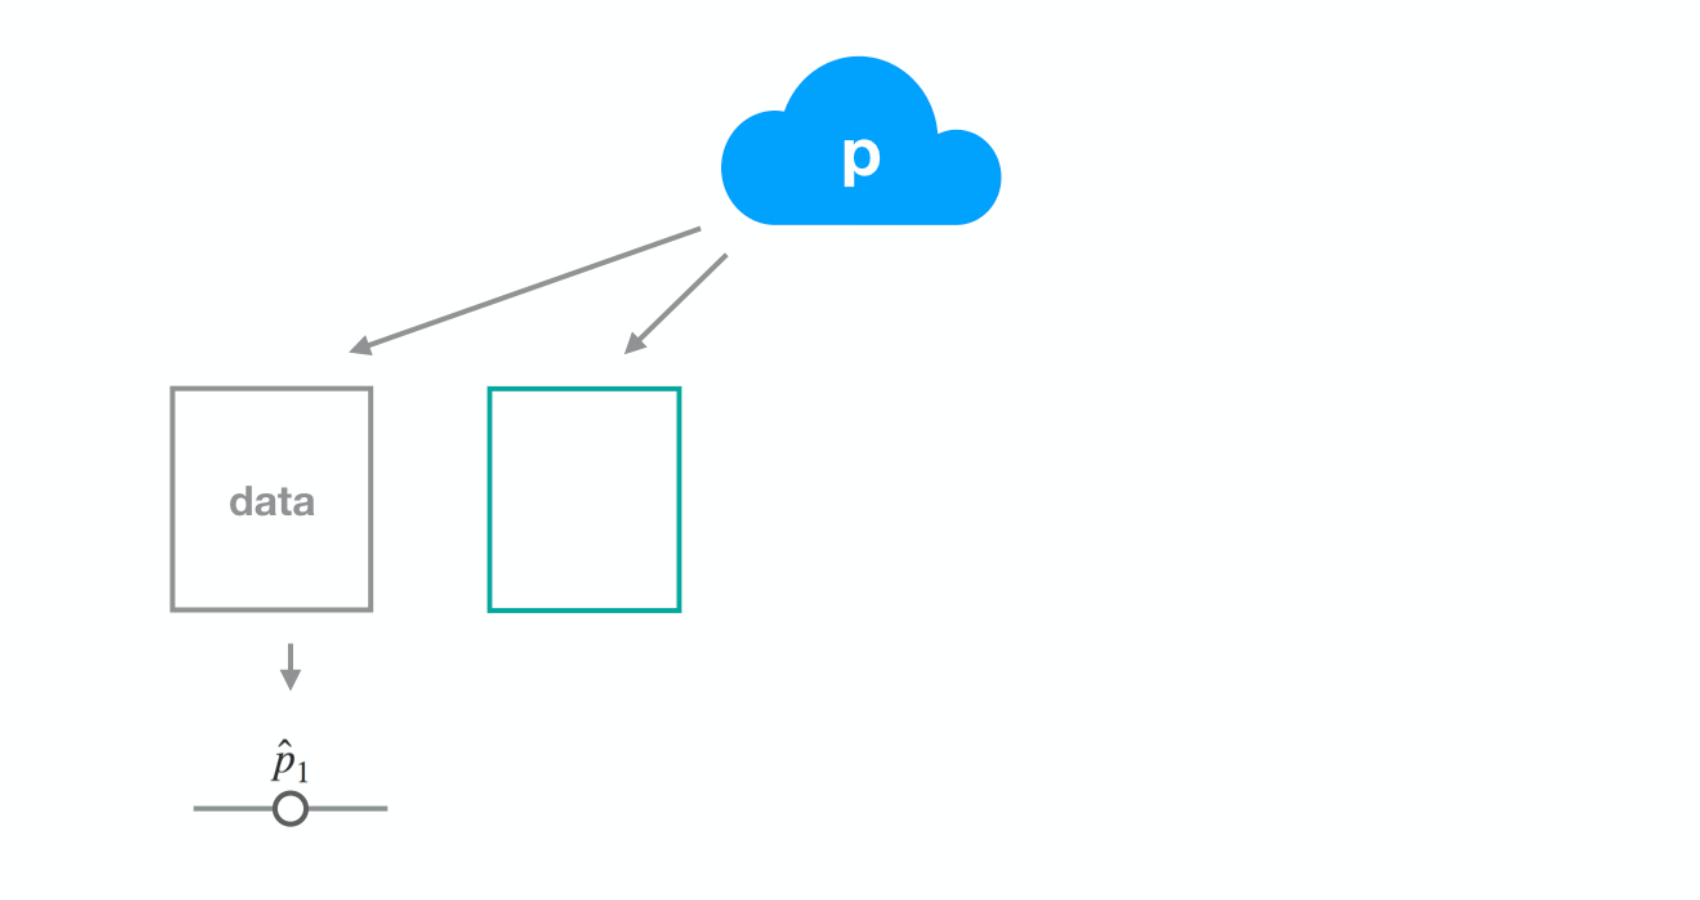
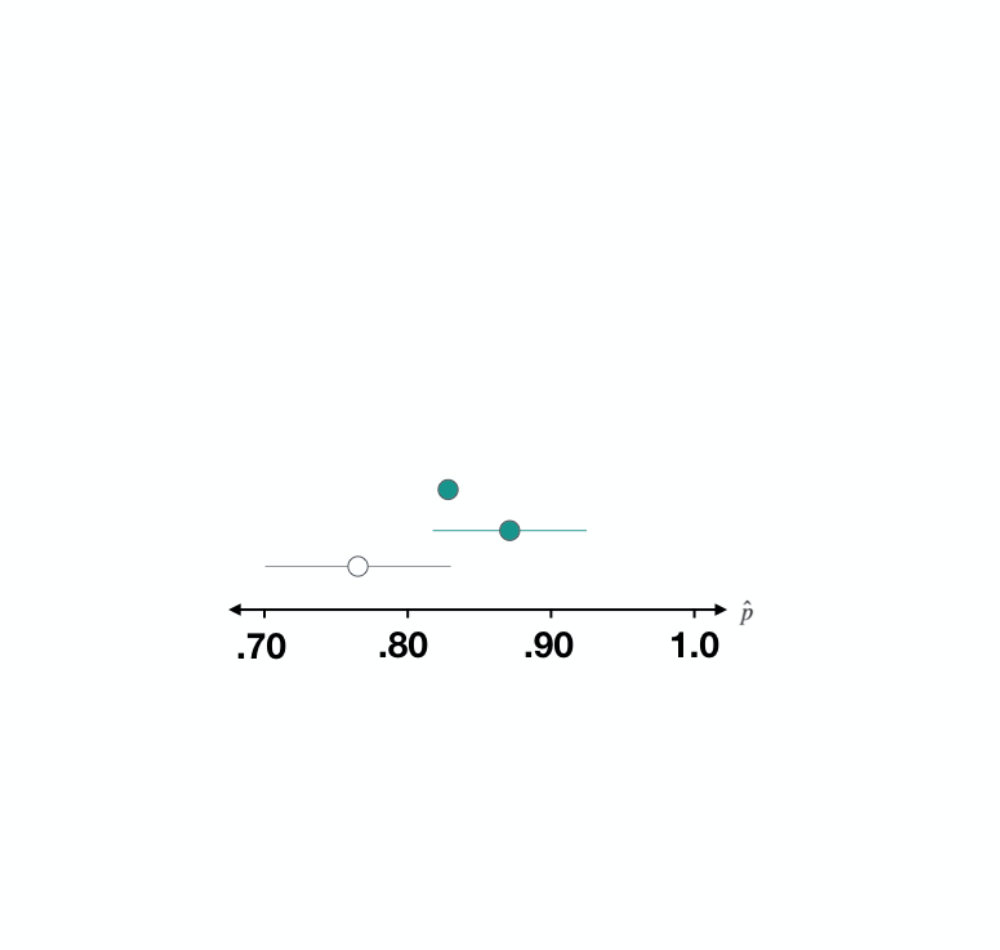
Dataset 1

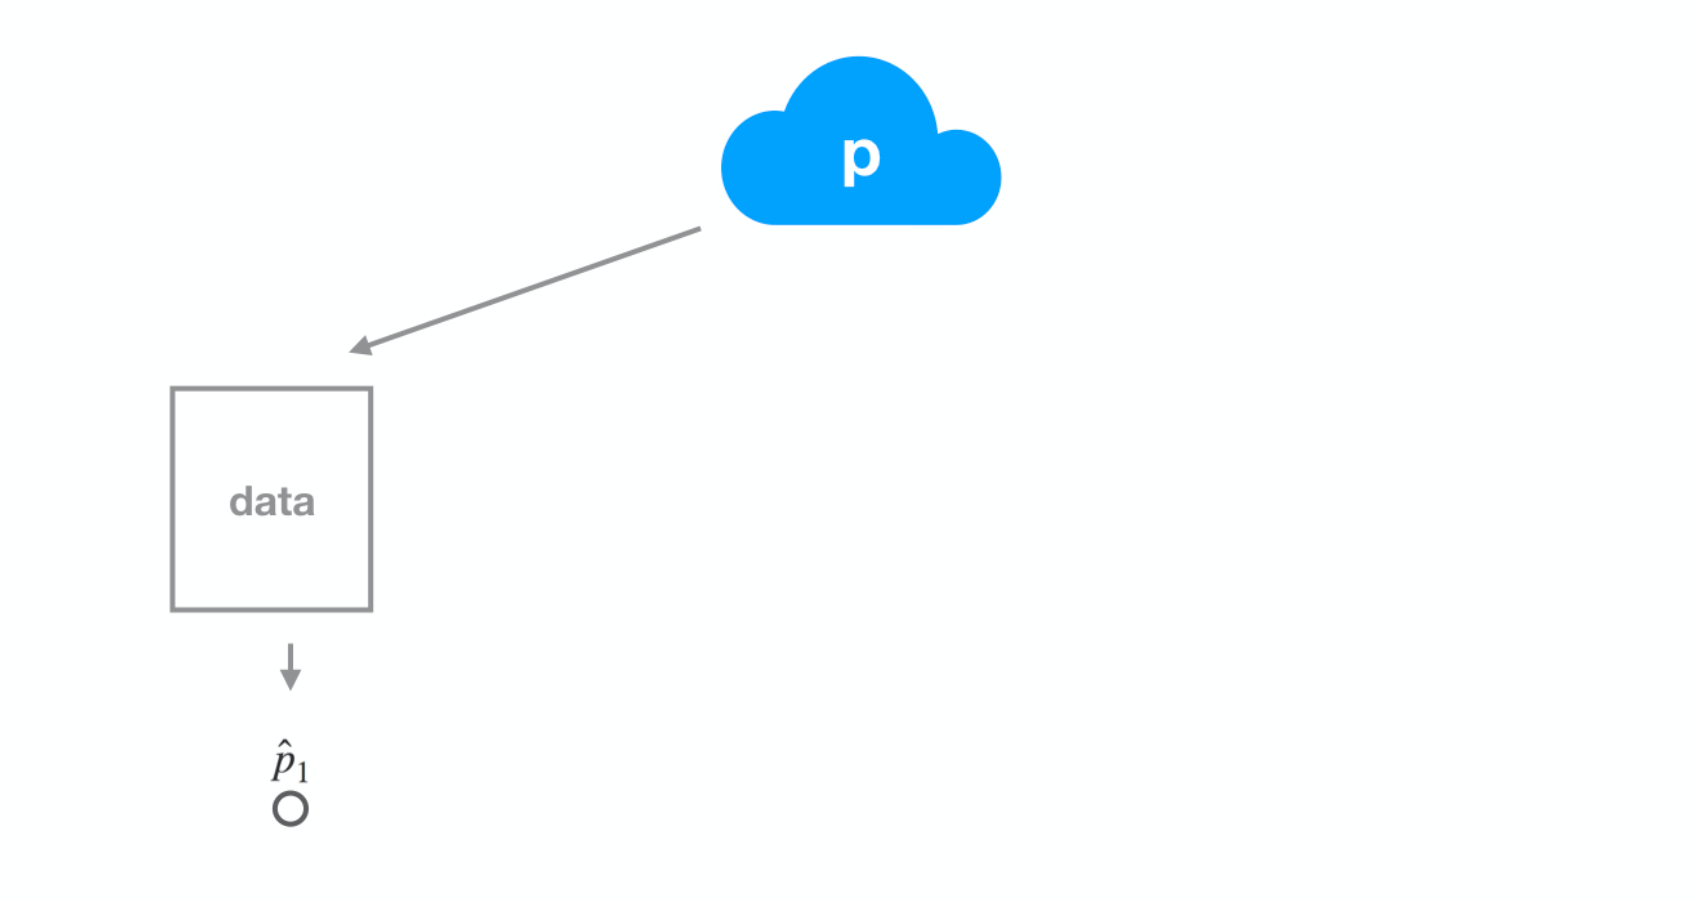
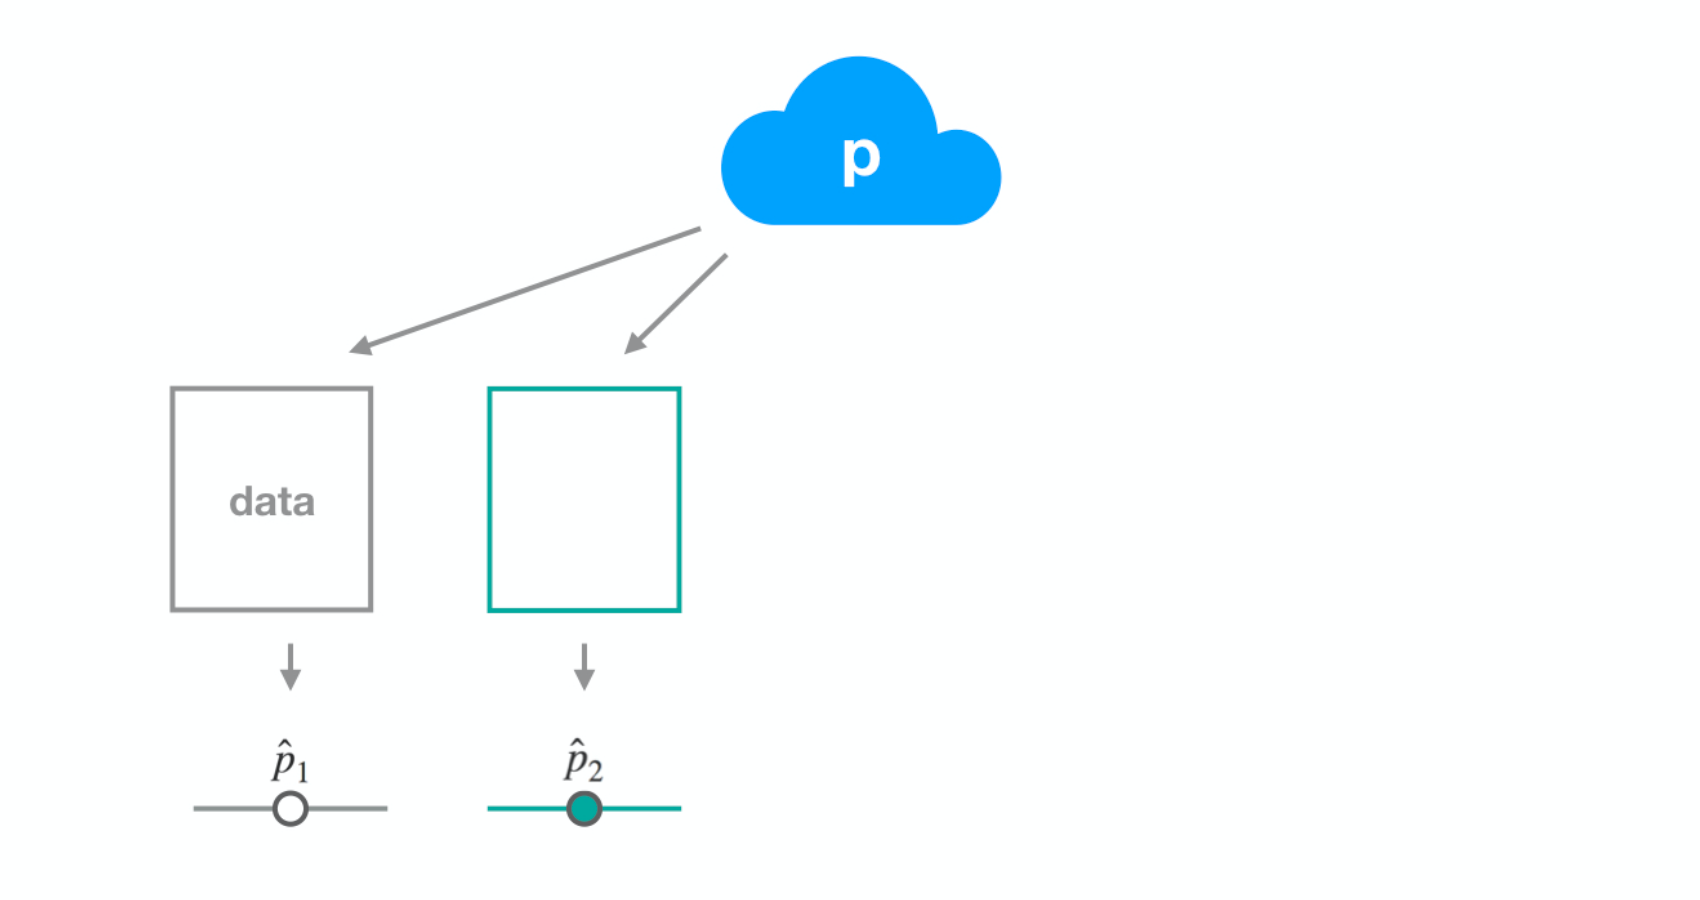
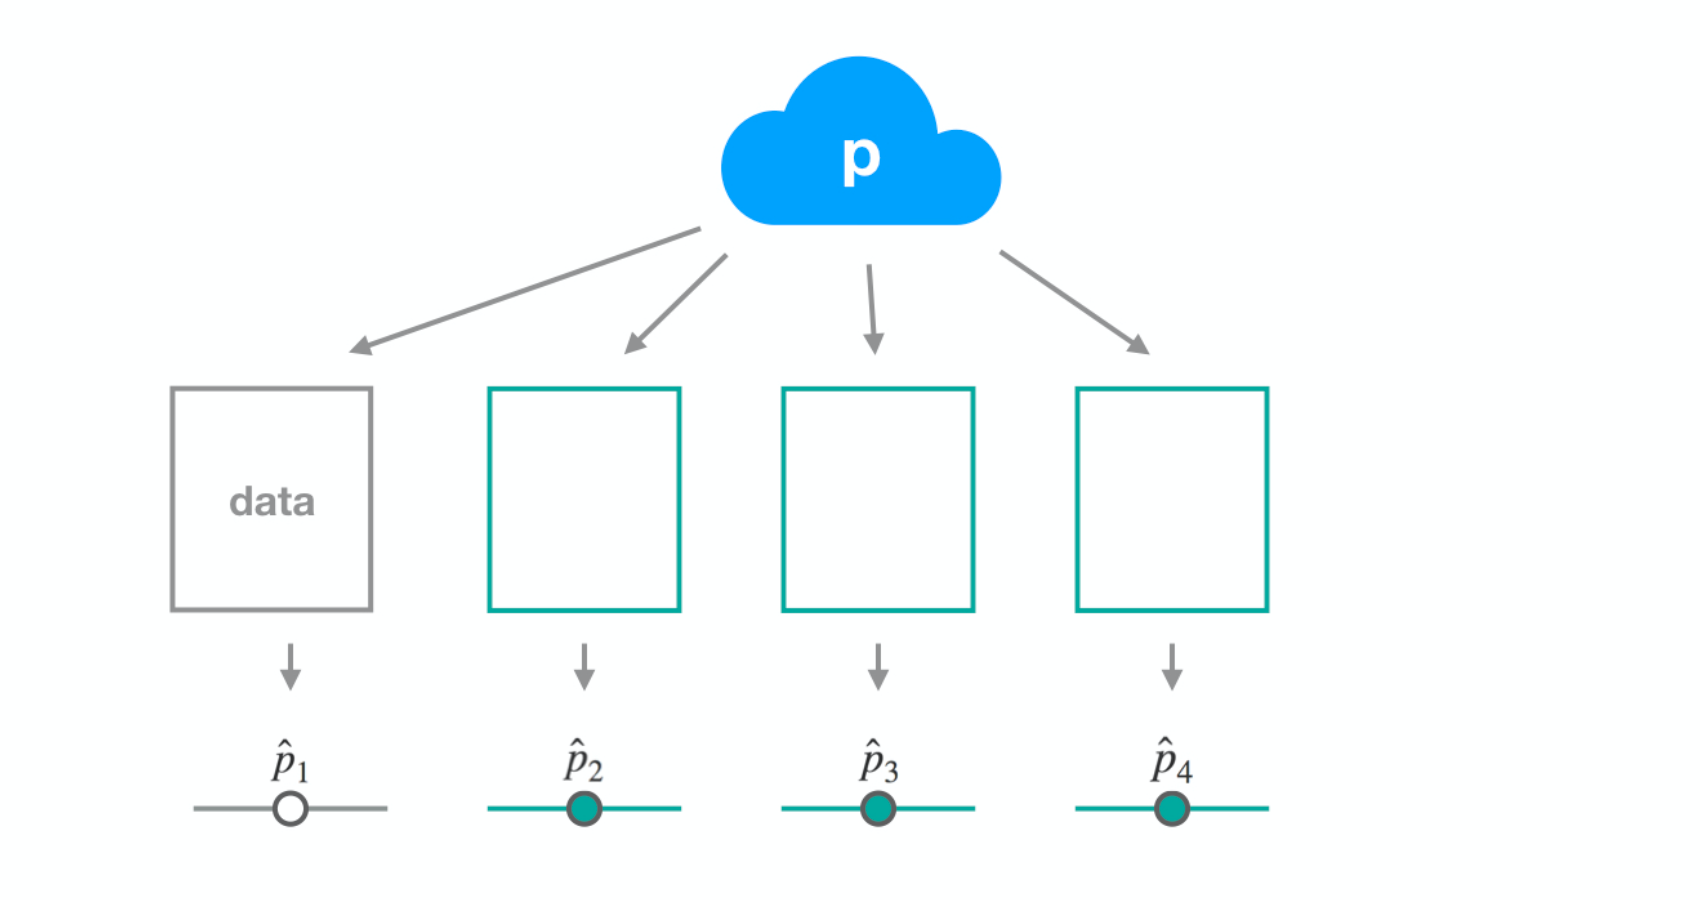
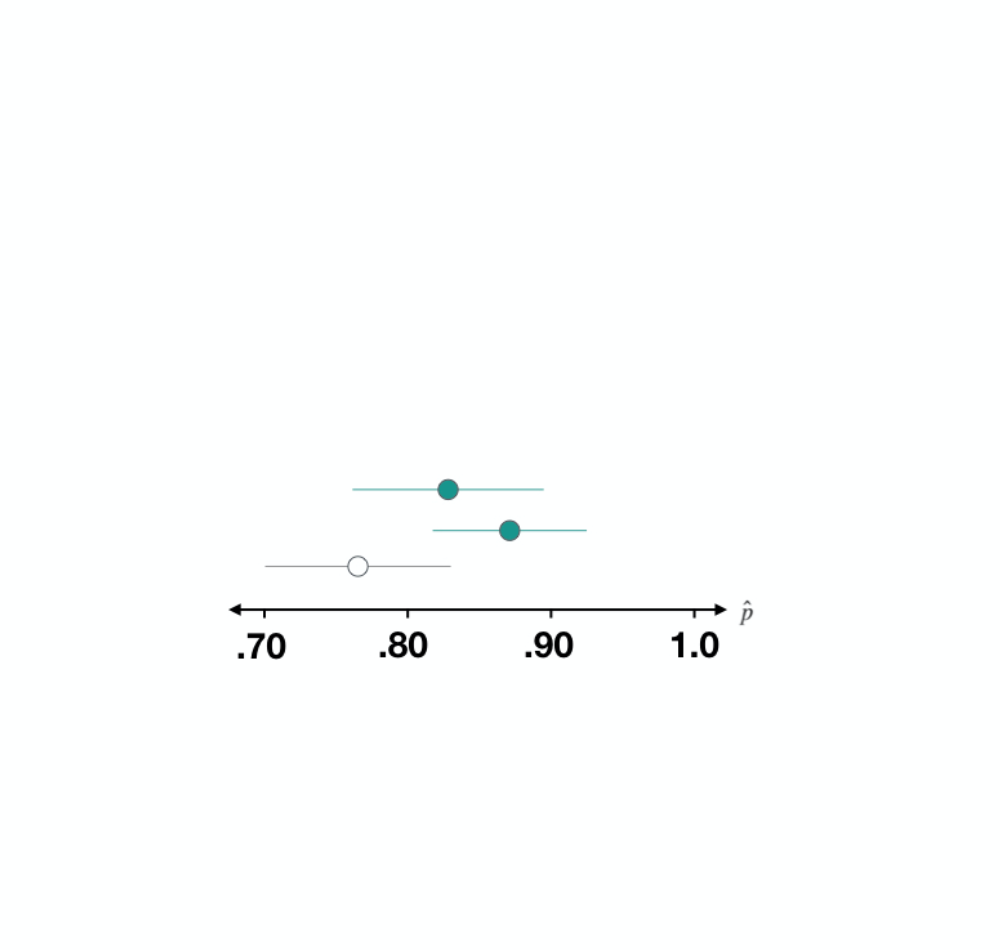
Dataset 2
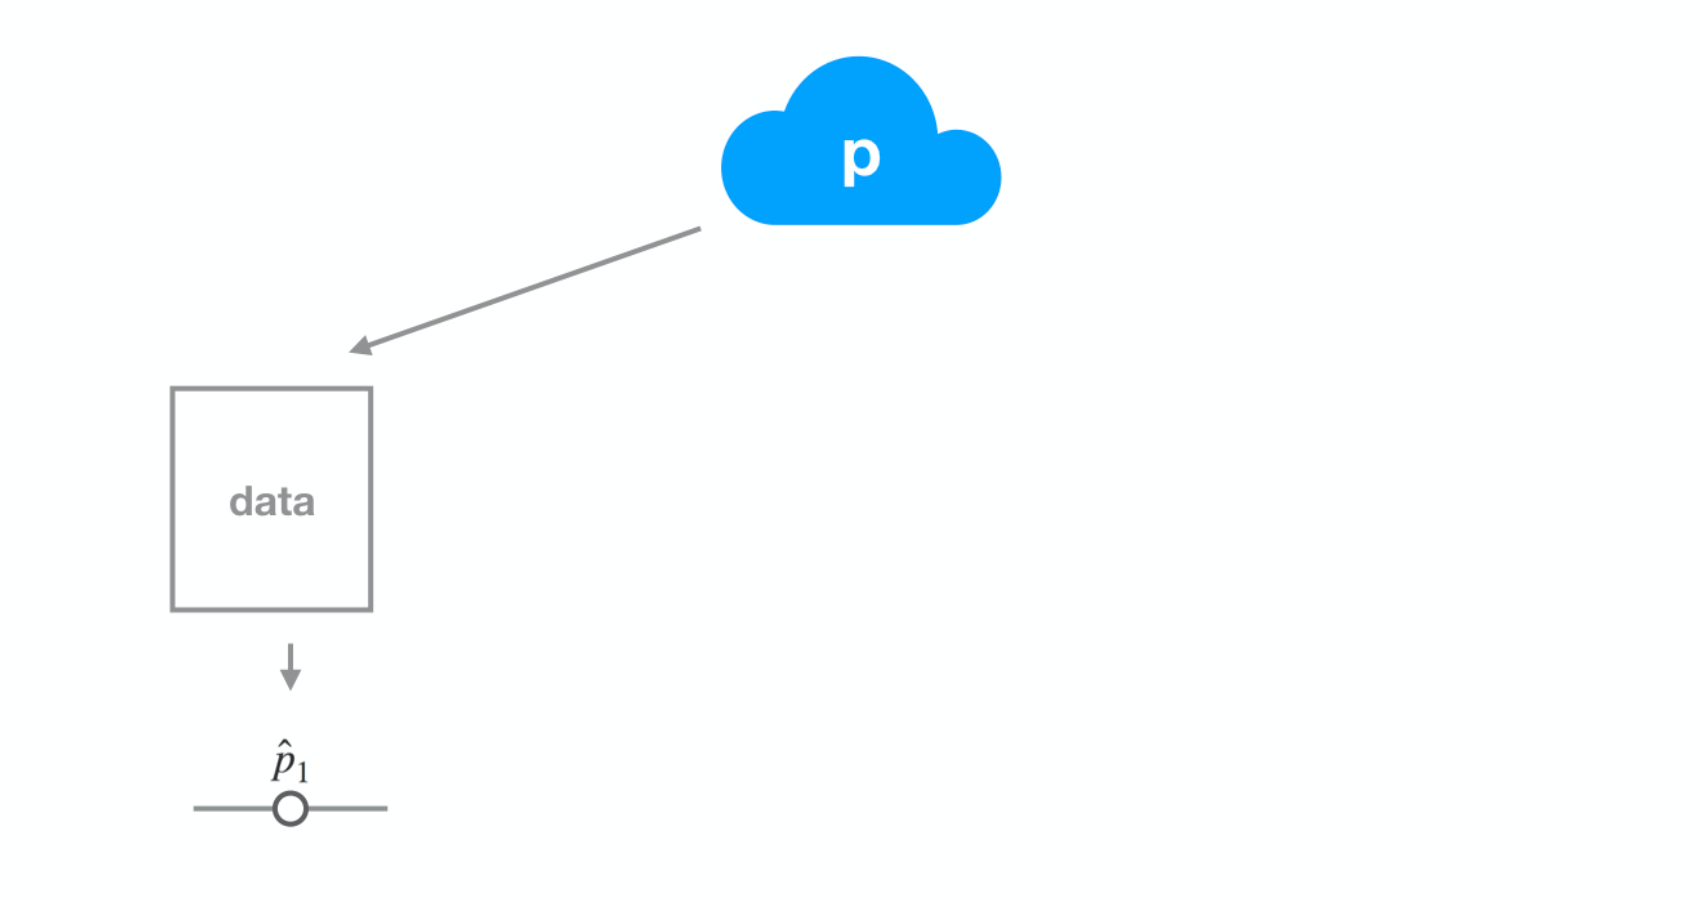
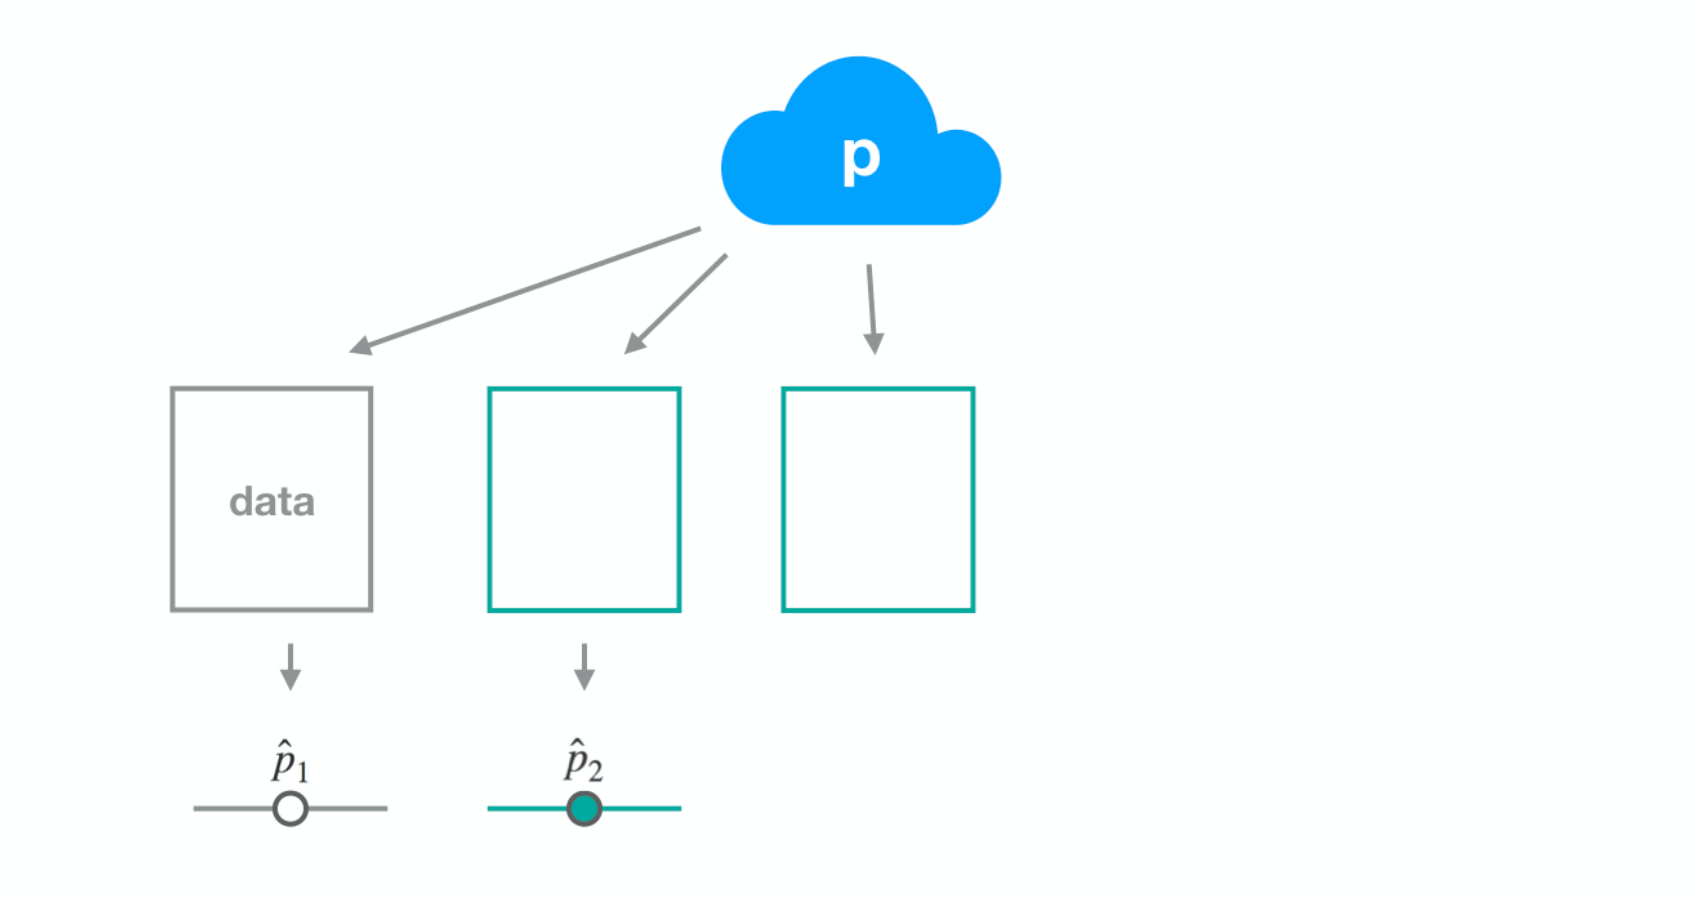
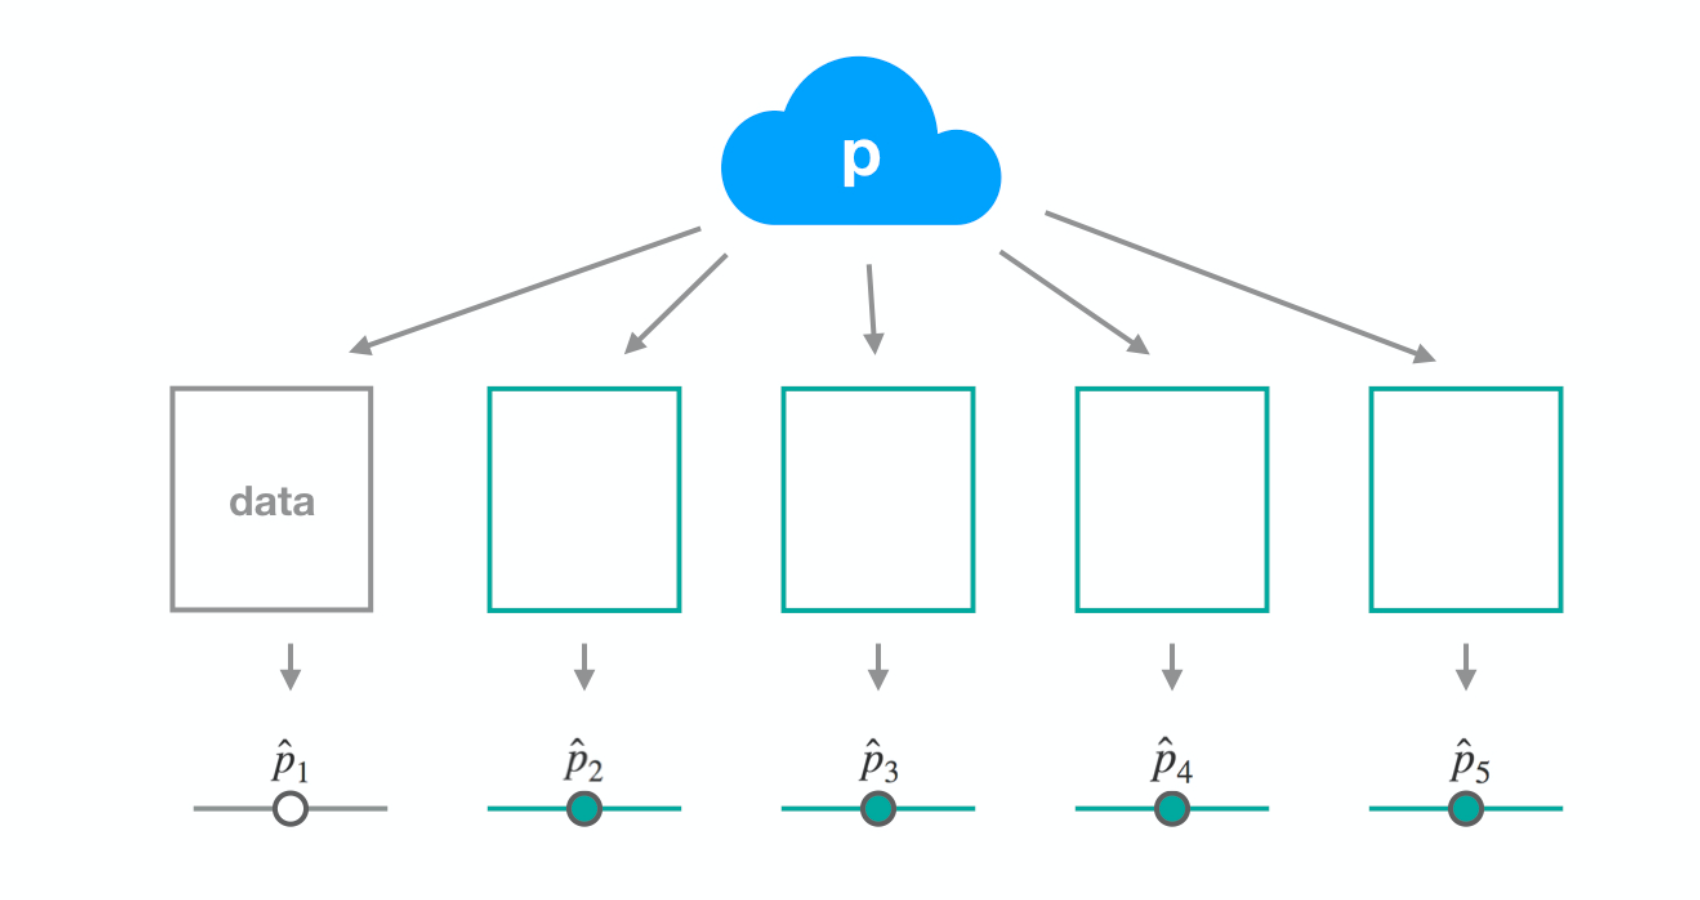
Dataset 3
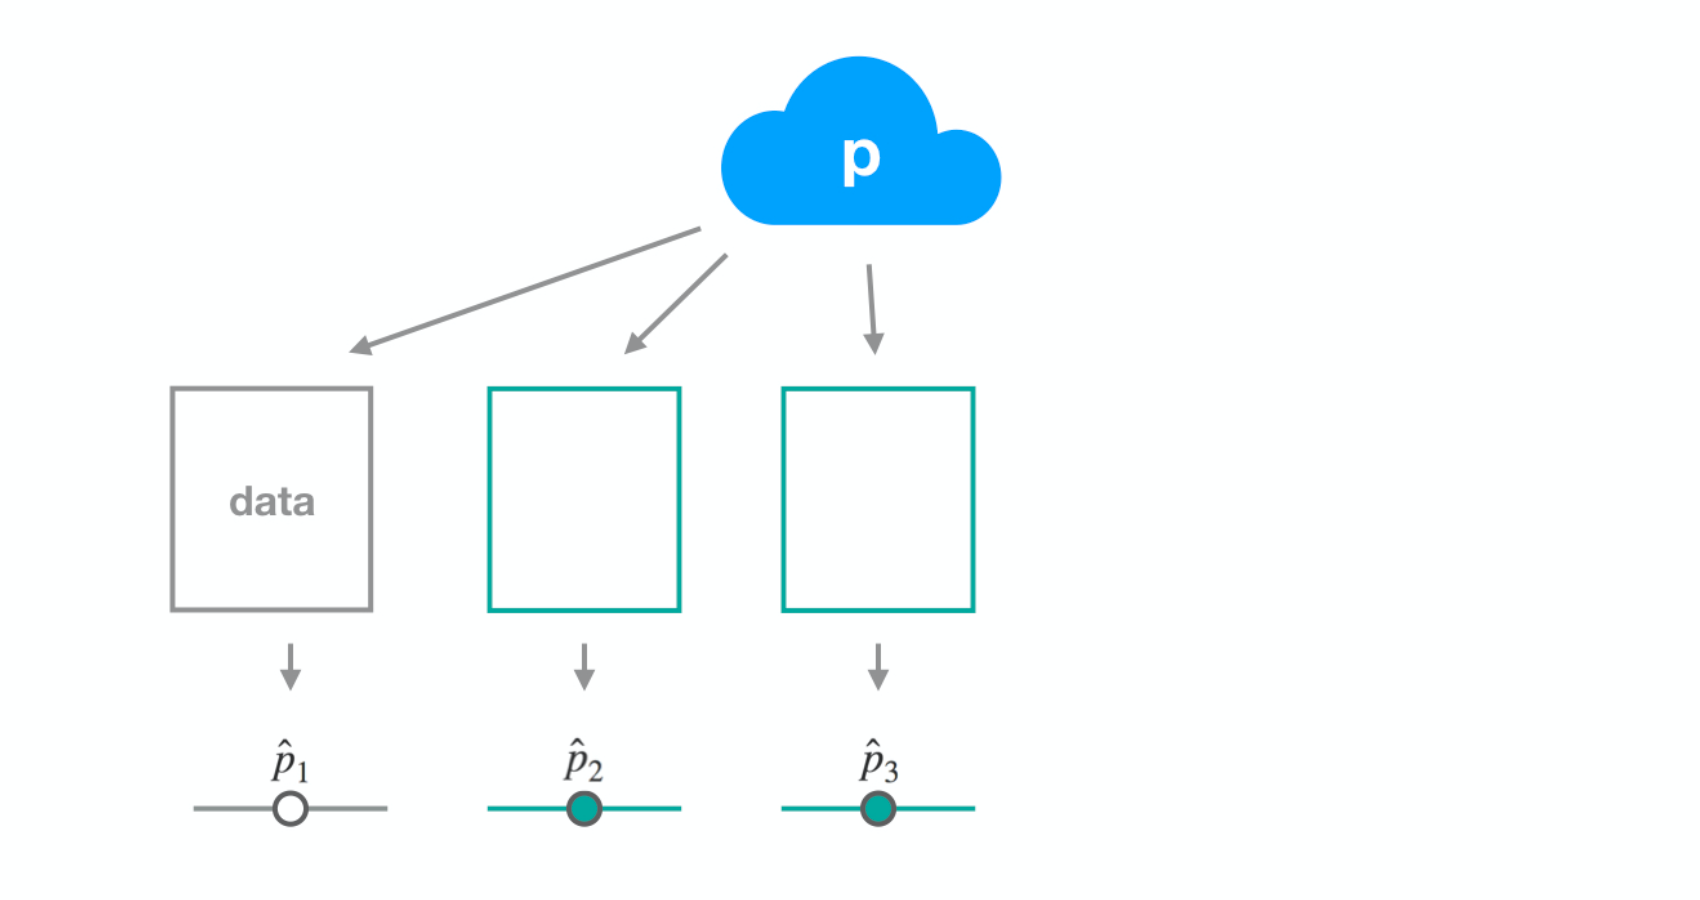
Dataset 3
Dataset 3
Dataset 3
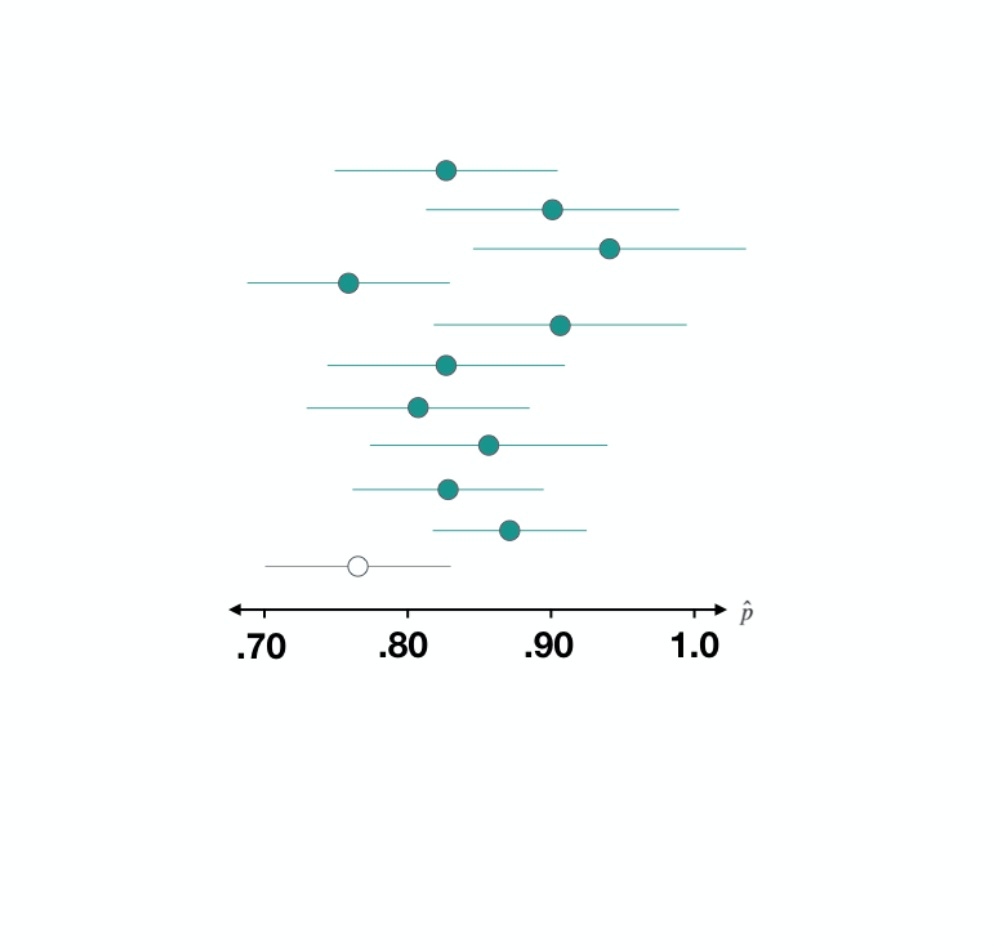
Dataset 3
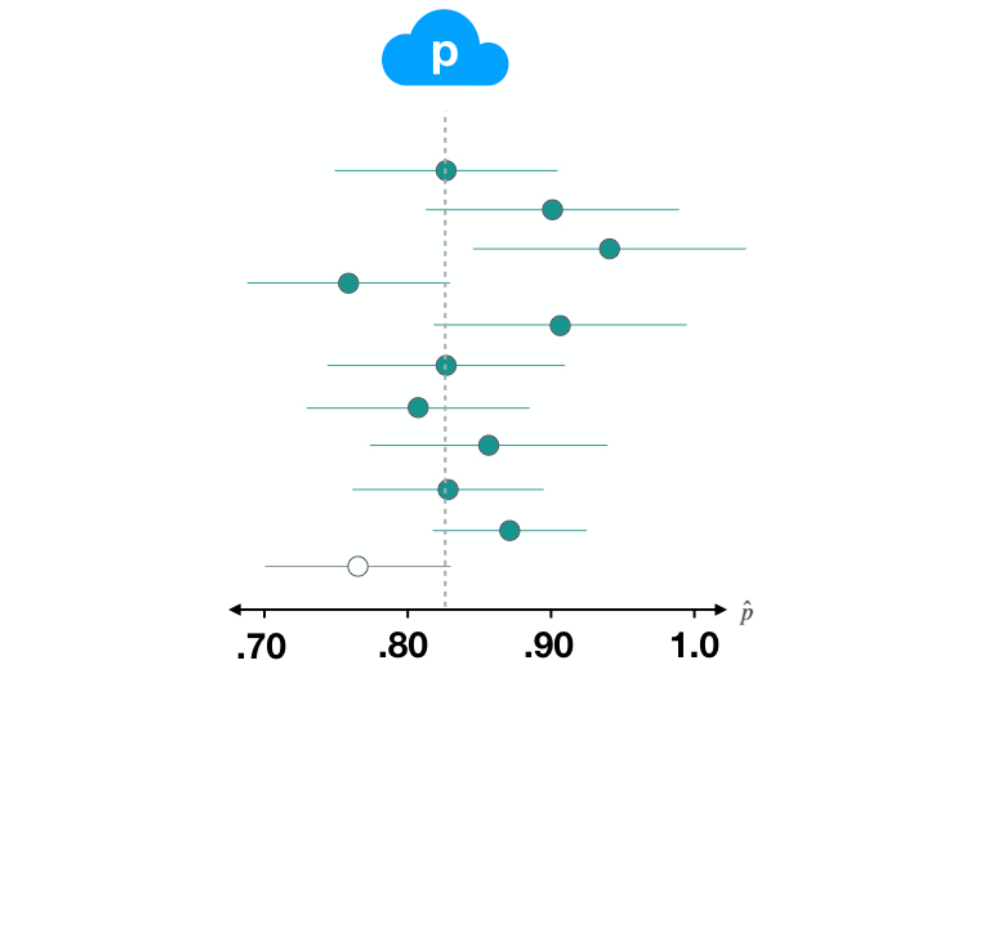
Dataset 3
Inferensi untuk Data Kategorik di R
Andrew Bray
Assistant Professor of Statistics at Reed College

