Rekap transaksi
Analisis Keranjang Belanja di R

Christopher Bruffaerts
Statistician
Poin penting dalam analisis keranjang belanja
Analisis keranjang belanja
Fokus pada apa, bukan berapa banyak;
yaitu apa saja yang ada di keranjang pelanggan?
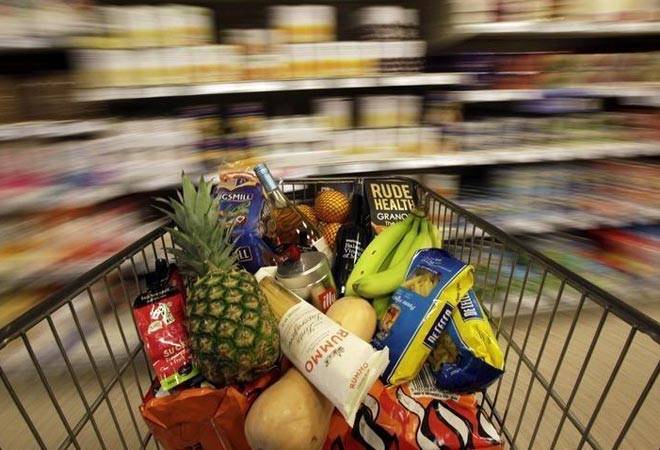
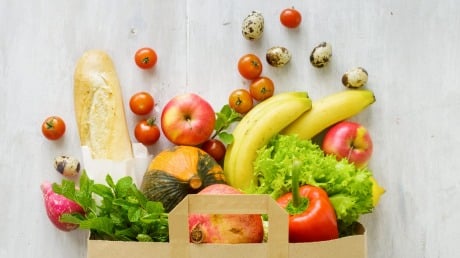
Dataset Groceries
Kembali ke Toko Kelontong
Kepadatan Groceries
# Plotting a sample of 200 transactions
image(sample(Groceries, 200))
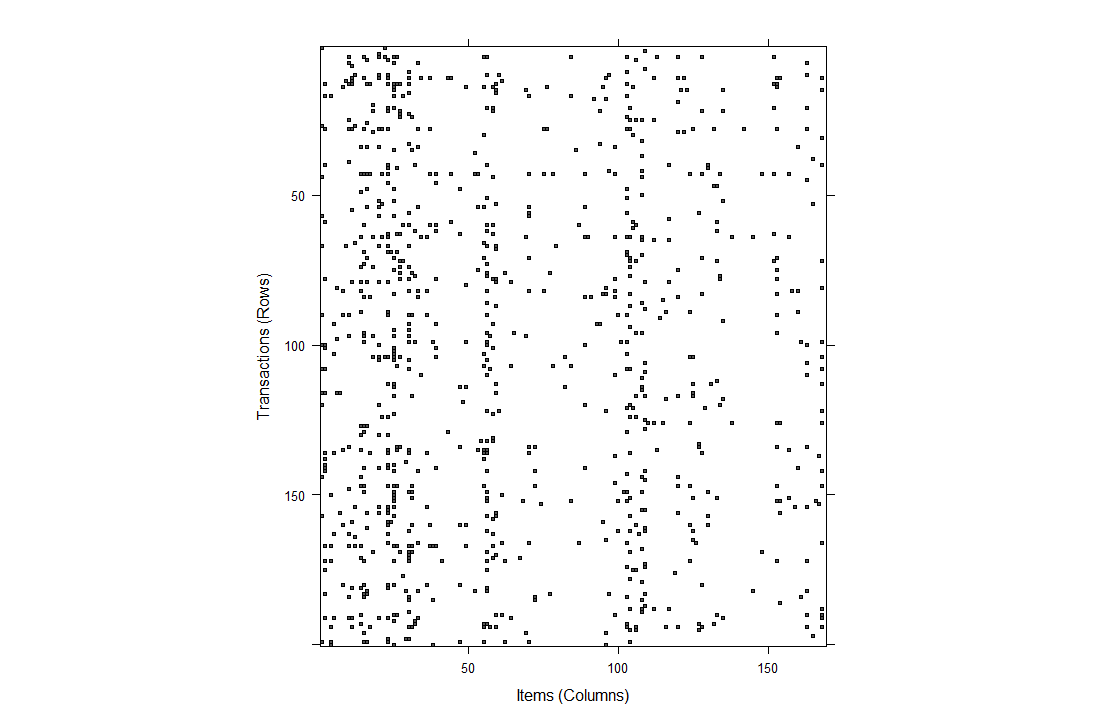
1 Kepadatan matriks item adalah 2,6%.
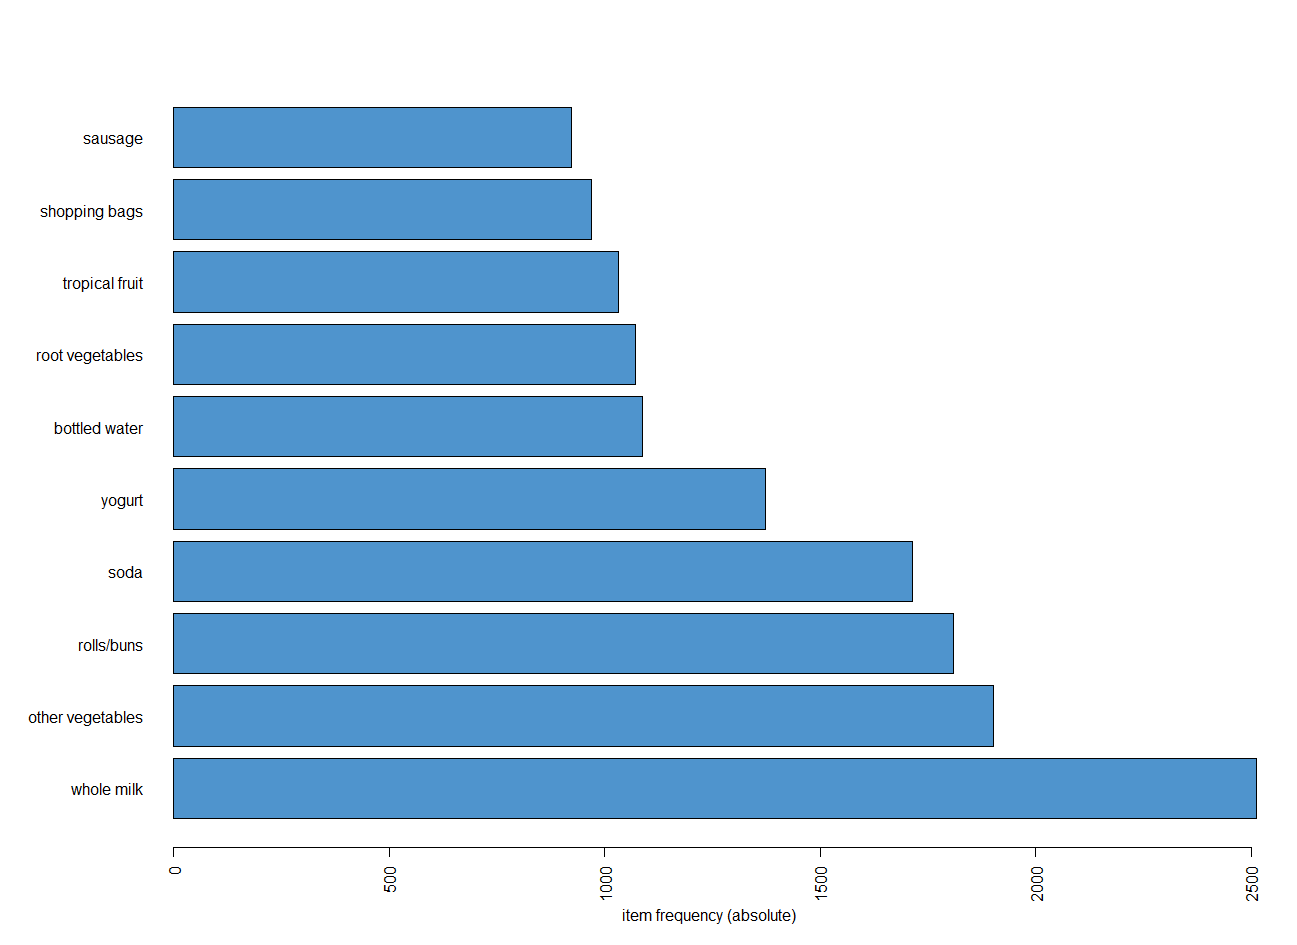
Item terpopuler dan terendah
Item terpopuler
itemFrequencyPlot(Groceries,type="relative",
                  topN=10,horiz=TRUE,col='steelblue3')
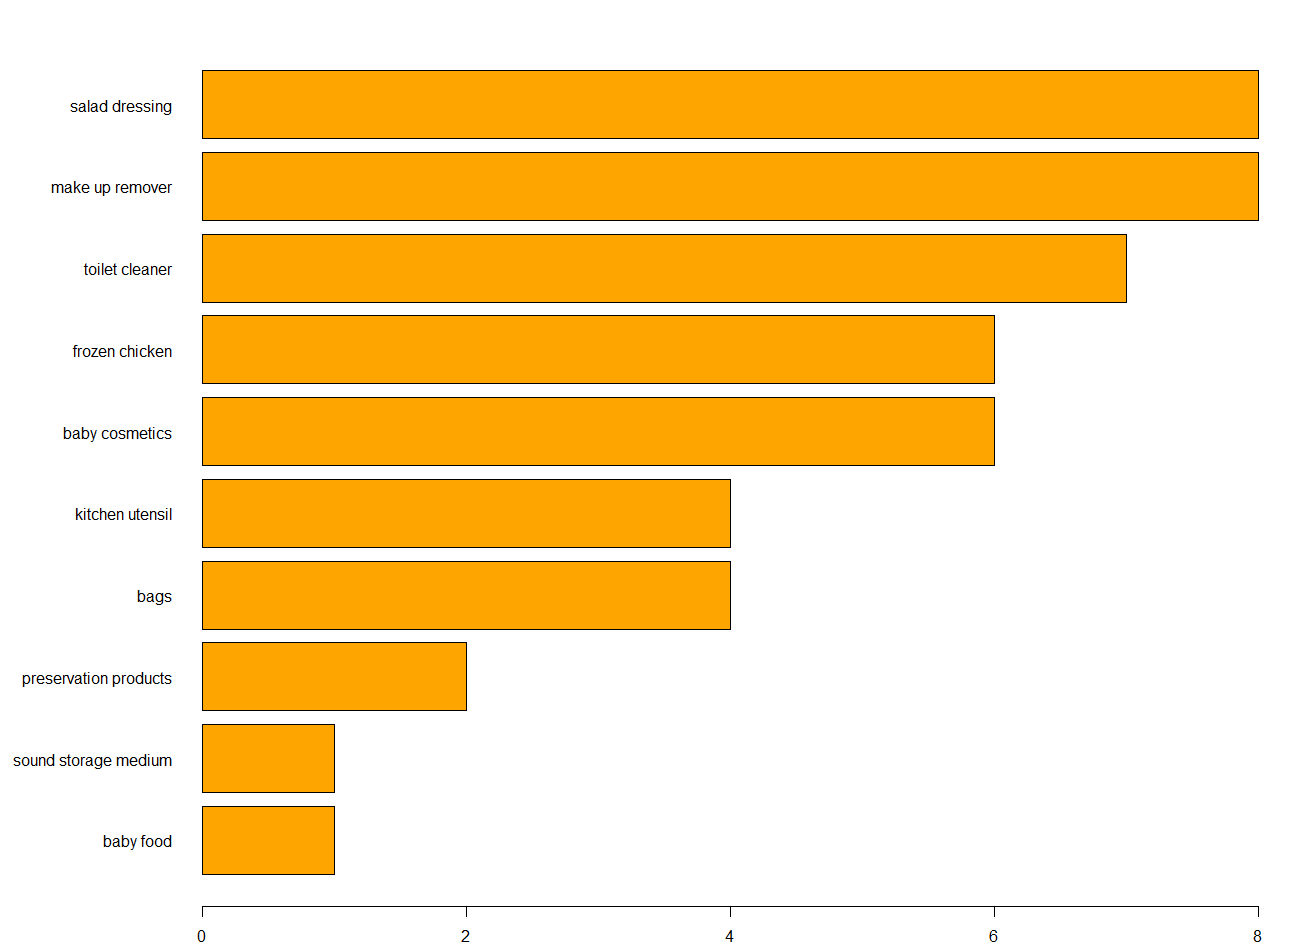
Item paling tidak populer
par(mar=c(2,10,2,2), mfrow=c(1,1))
barplot(sort(table(unlist(LIST(Groceries))))[1:10],
        horiz = TRUE,las = 1,col='orange')
Dataset MovieLens
MovieLens: Sistem rekomendasi berbasis web yang menyarankan film untuk ditonton pengguna.