Mengeksplorasi Data dengan Visualisasi
Manipulasi Data di Julia

Katerina Zahradova
Instructor
Mengapa kita memvisualisasikan?
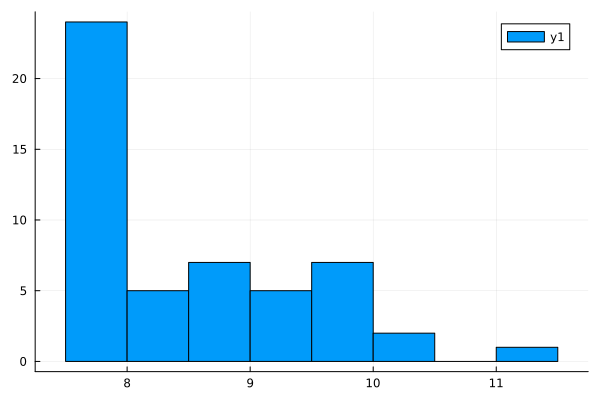
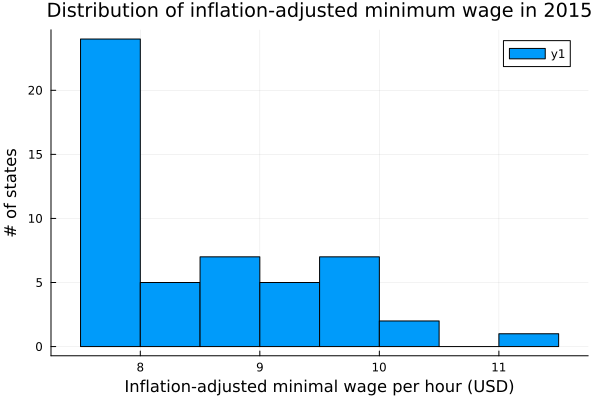
Histogram
# Make a histogram with default bins
wages_2015 = filter(wages.year == 2015, wages)
histogram(wages_2015.eff_min_wage_2020_dollars)
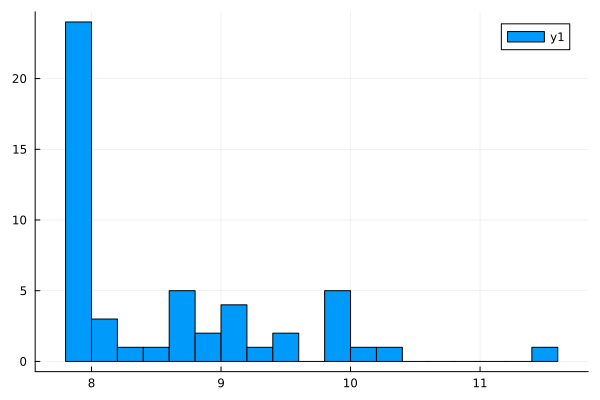
# Specifying the number of bins
wages_2015 = filter(wages.year == 2015, wages)
histogram(wages_2015.eff_min_wage_2020_dollars,
          bins = 25)
Memberi label plot
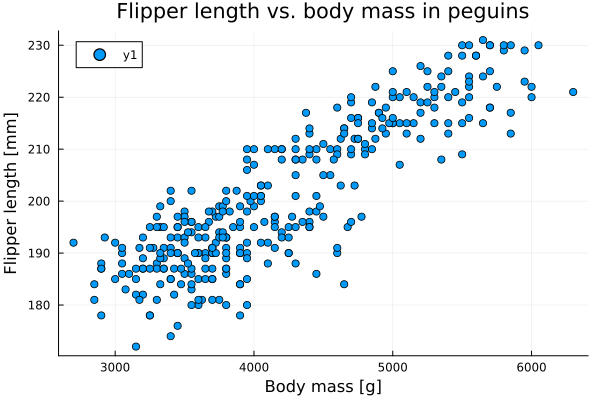
Scatter plot
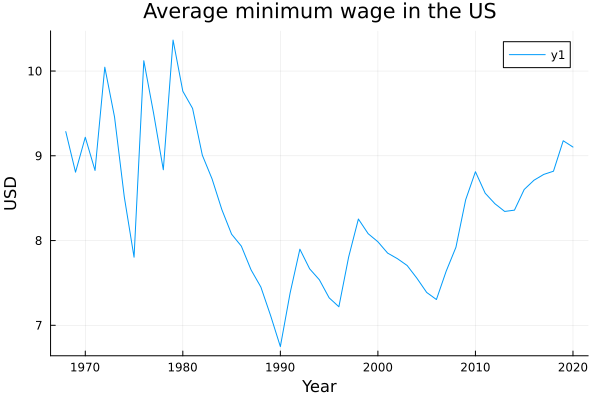
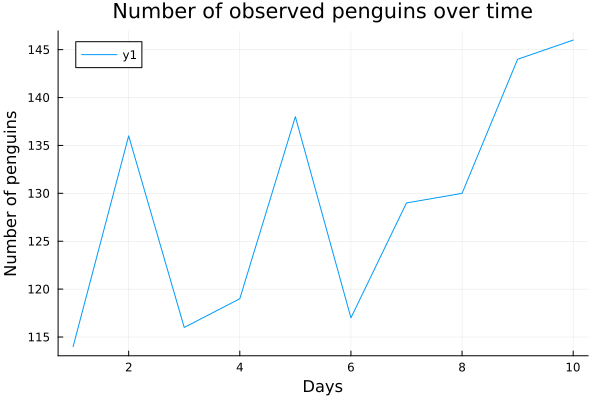
Plot garis
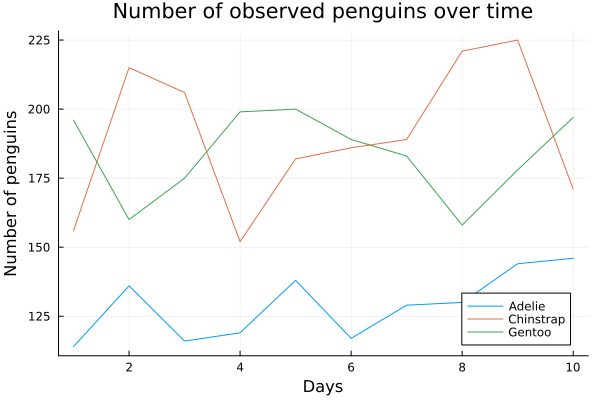
Beberapa garis
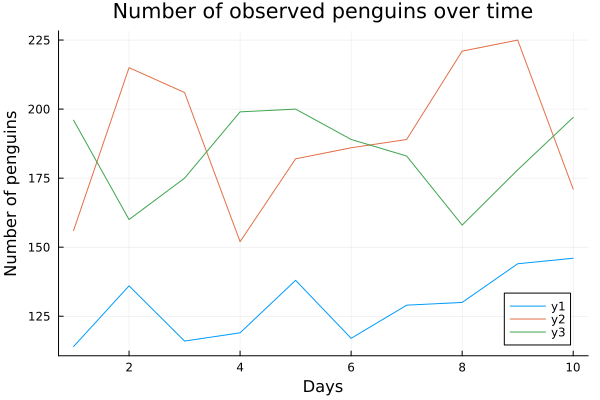
Beberapa garis dengan legenda