Memvisualisasikan deret waktu
Pengantar Visualisasi Data dengan Julia

Gustavo Vieira Suñe
Data Analyst
Deret waktu
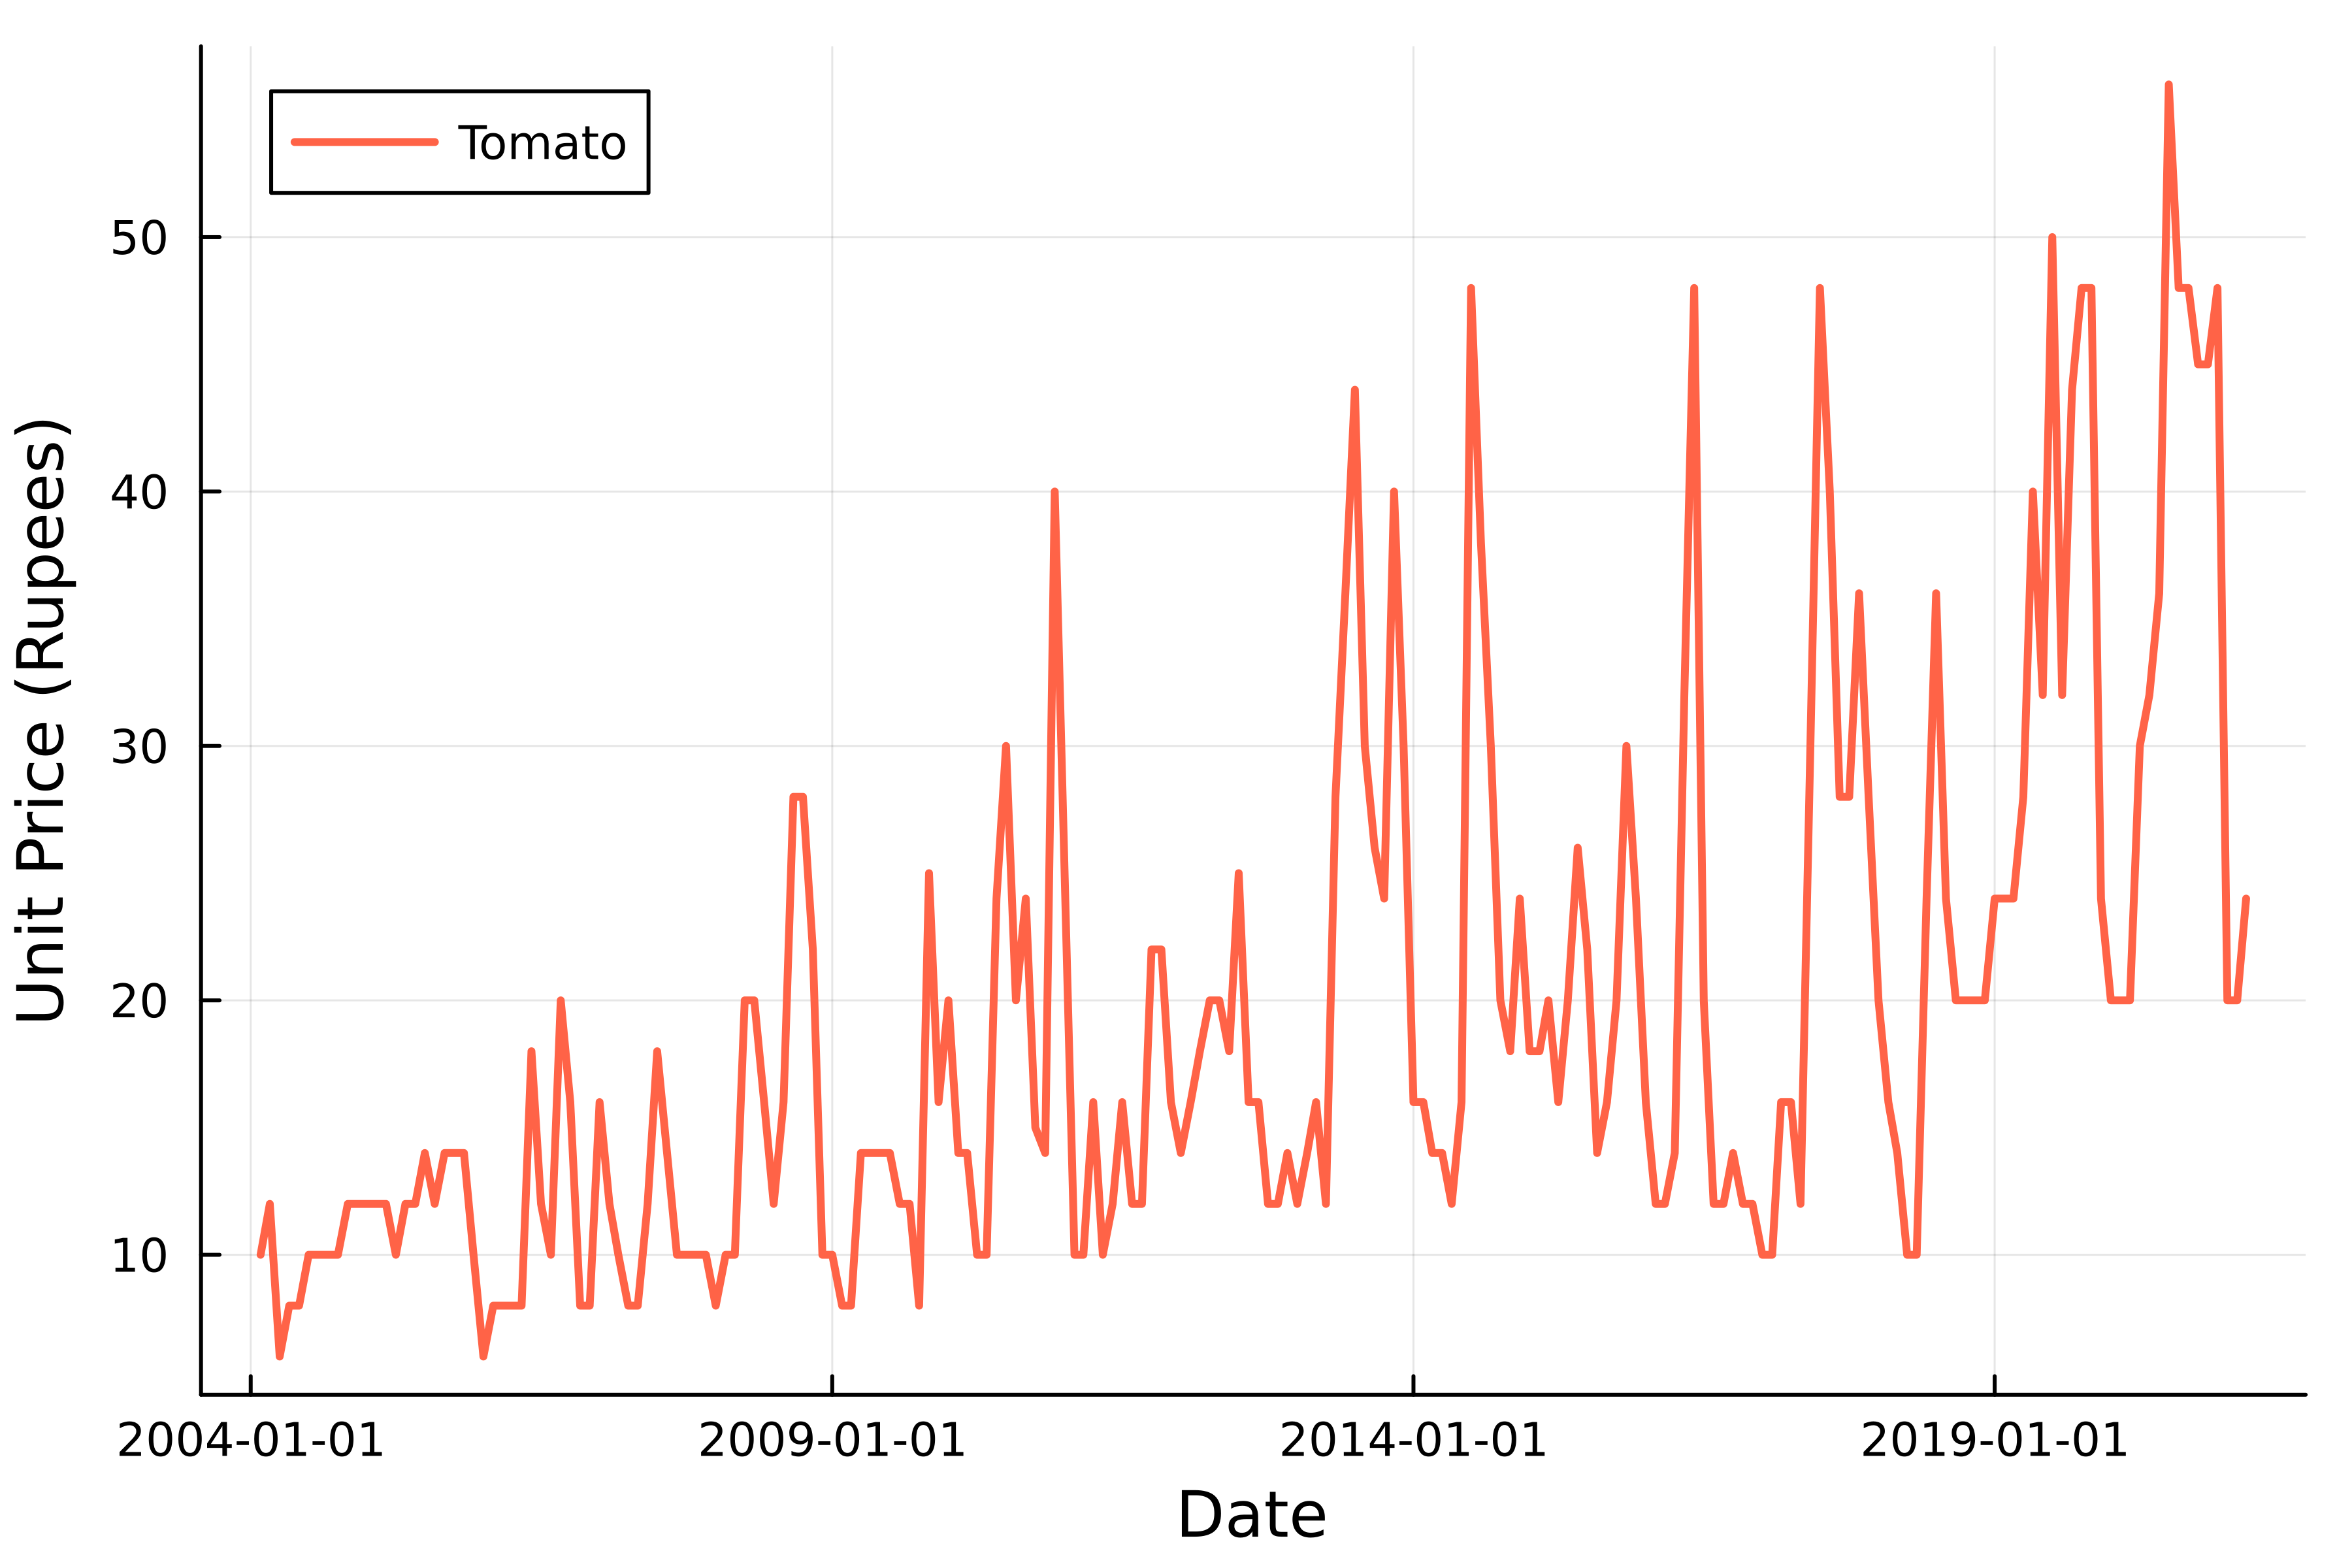
Harga tomat
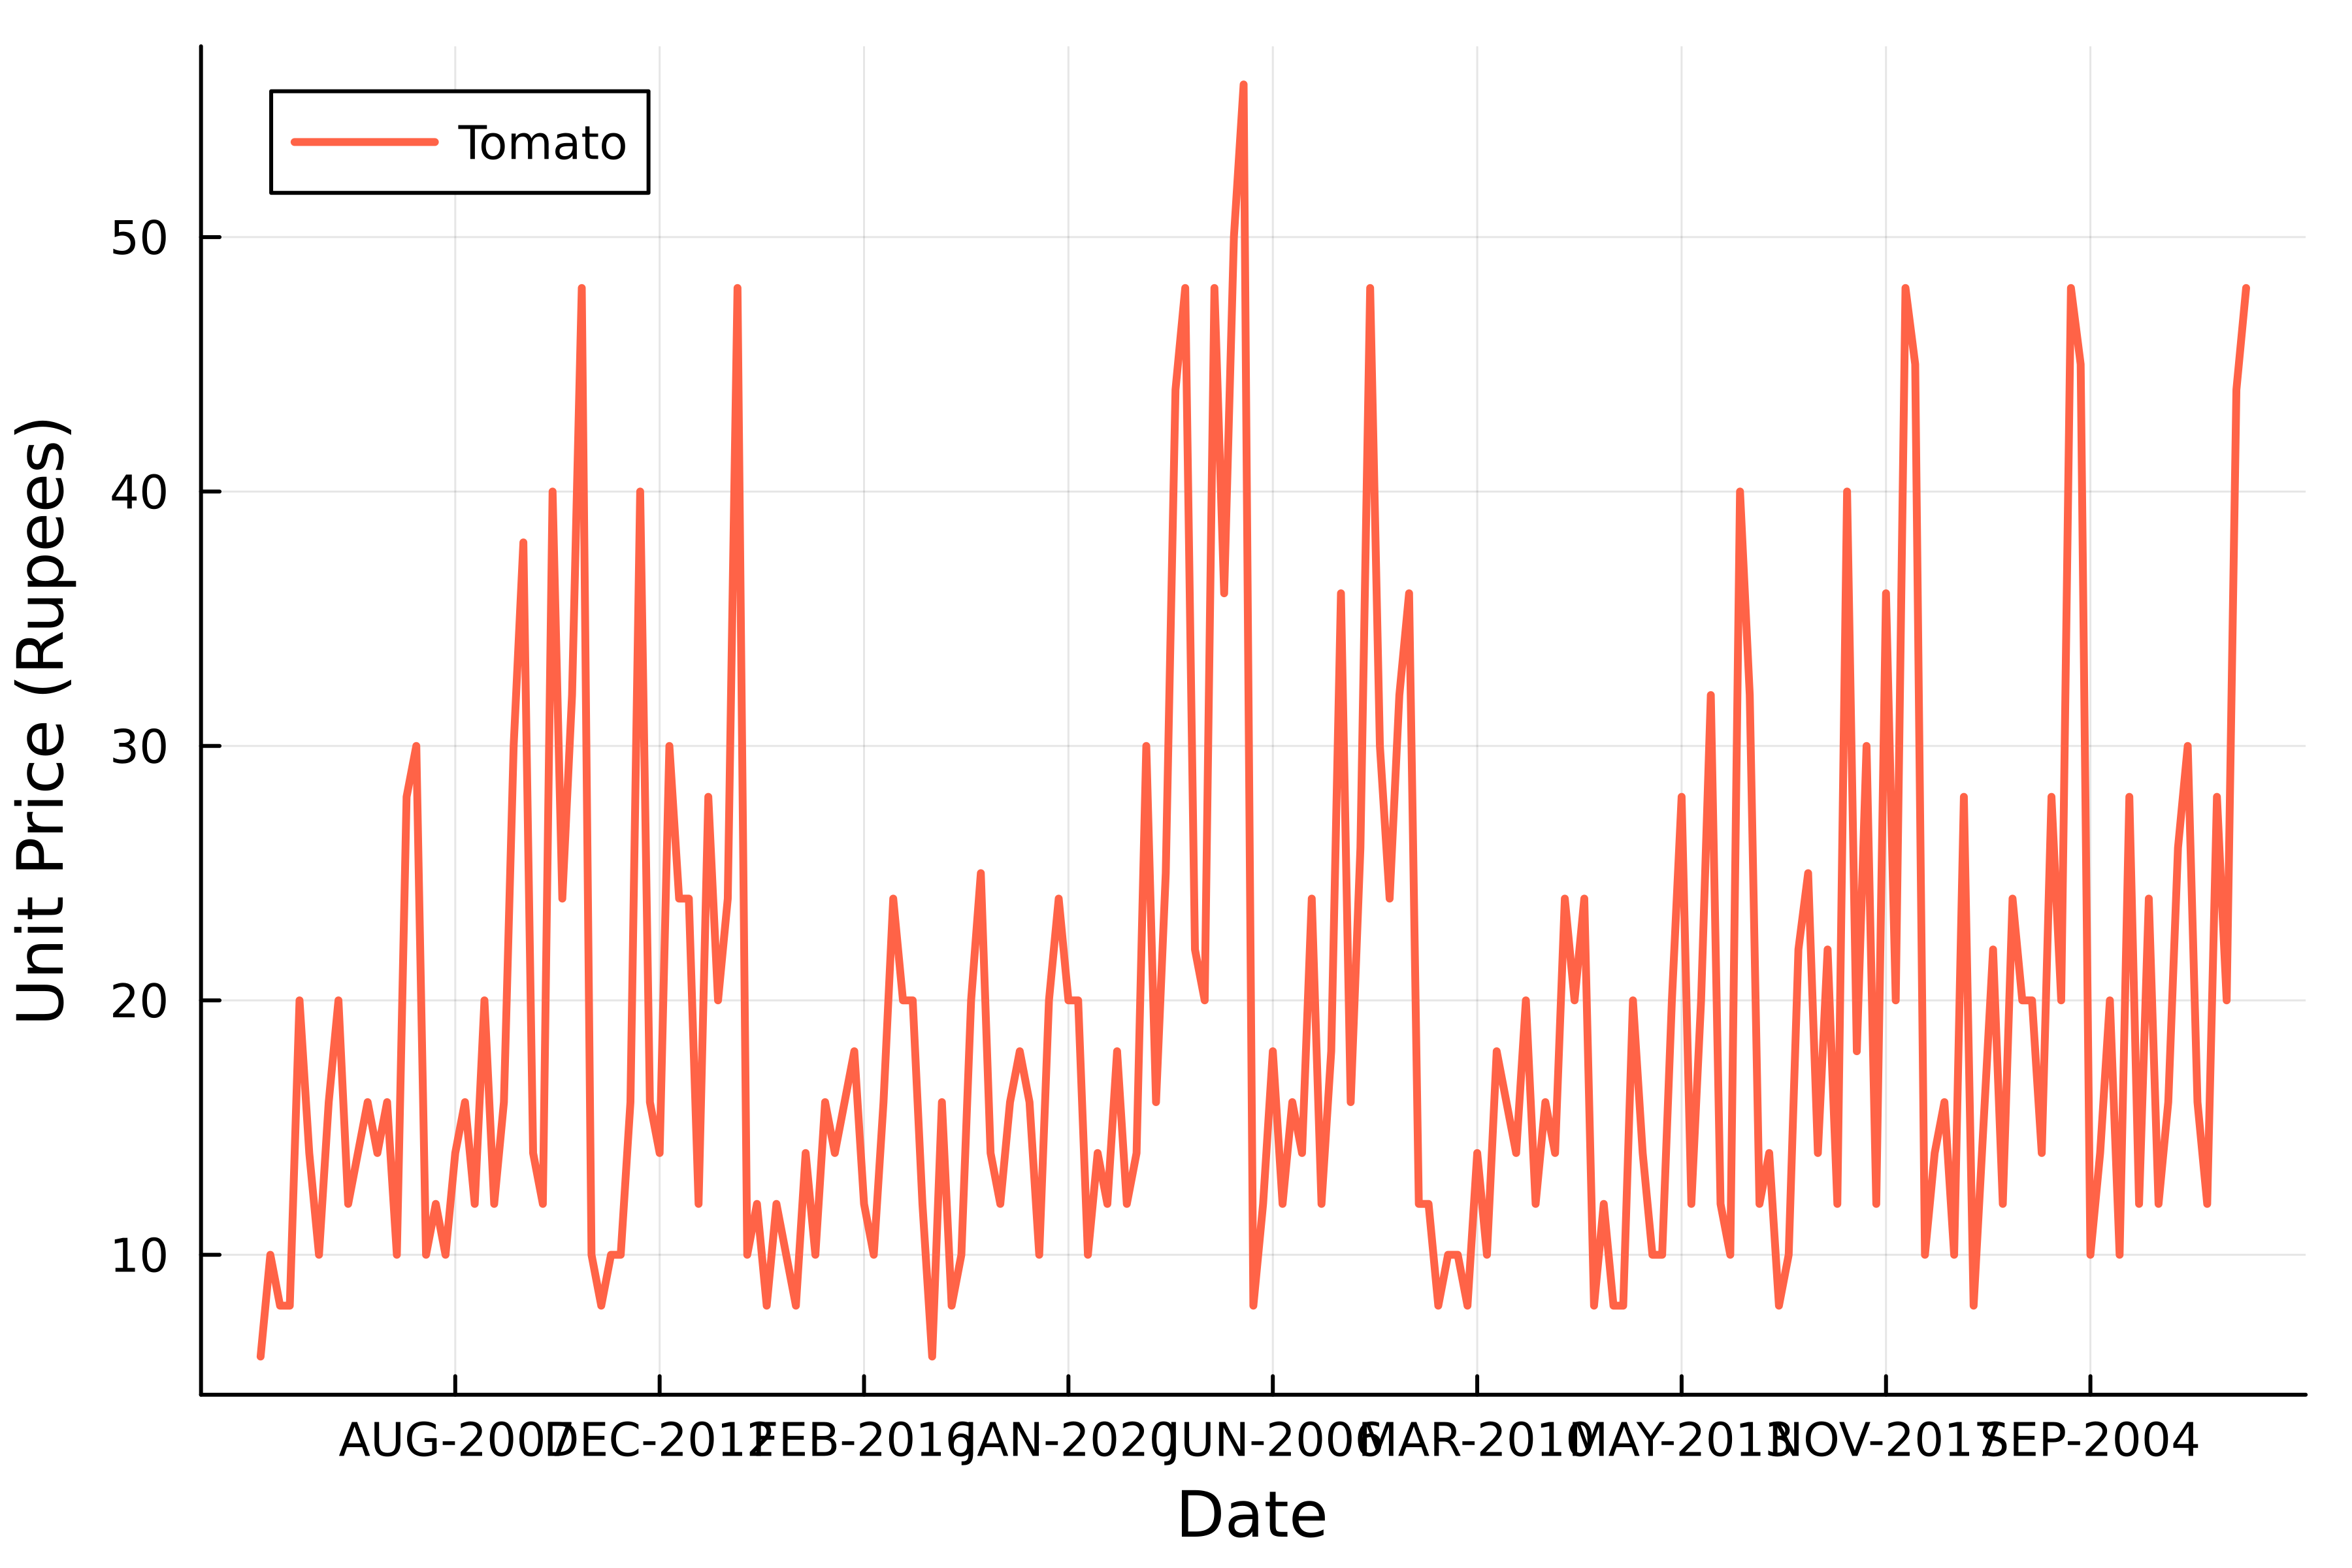
Deret waktu harga tomat
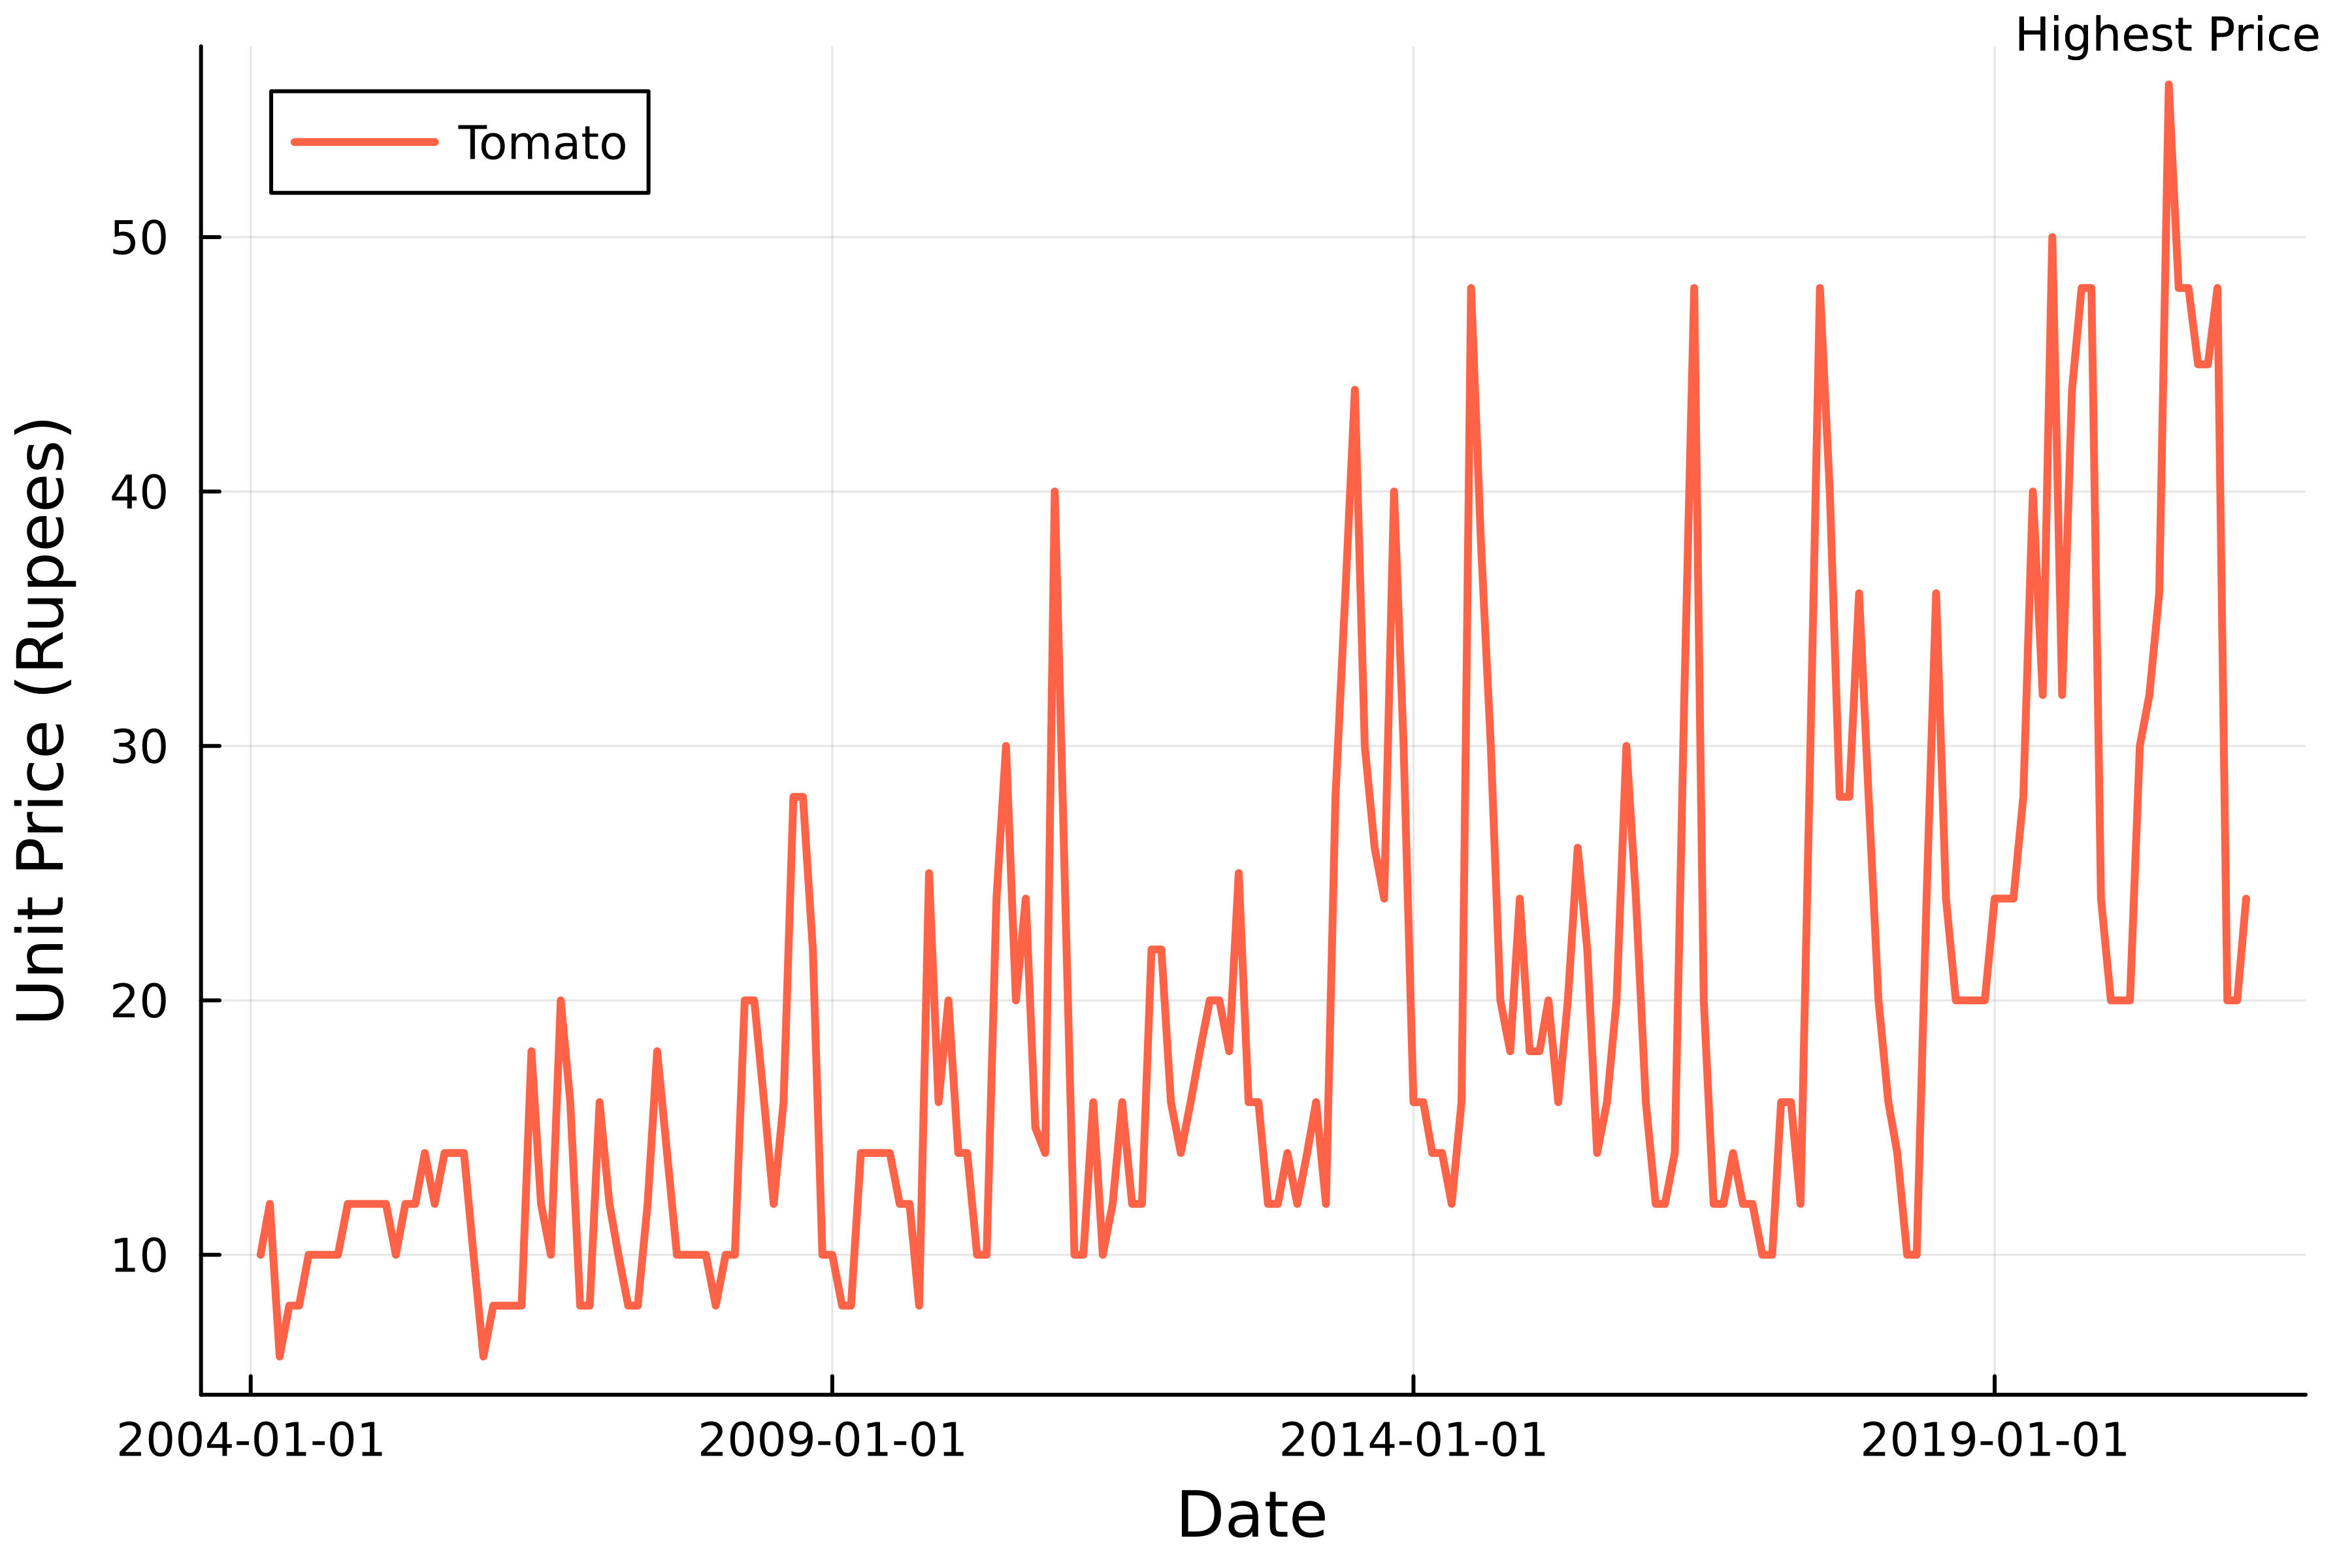
Memberi anotasi pada plot
Pengantar Visualisasi Data dengan Julia
Gustavo Vieira Suñe
Data Analyst

