Menguji nilai ekstrem dengan uji Grubbs

Pengantar Deteksi Anomali di R

Alastair Rushworth

Data Scientist

Penilaian visual tidak selalu andal!

boxplot(temperature, ylab = "Celsius")
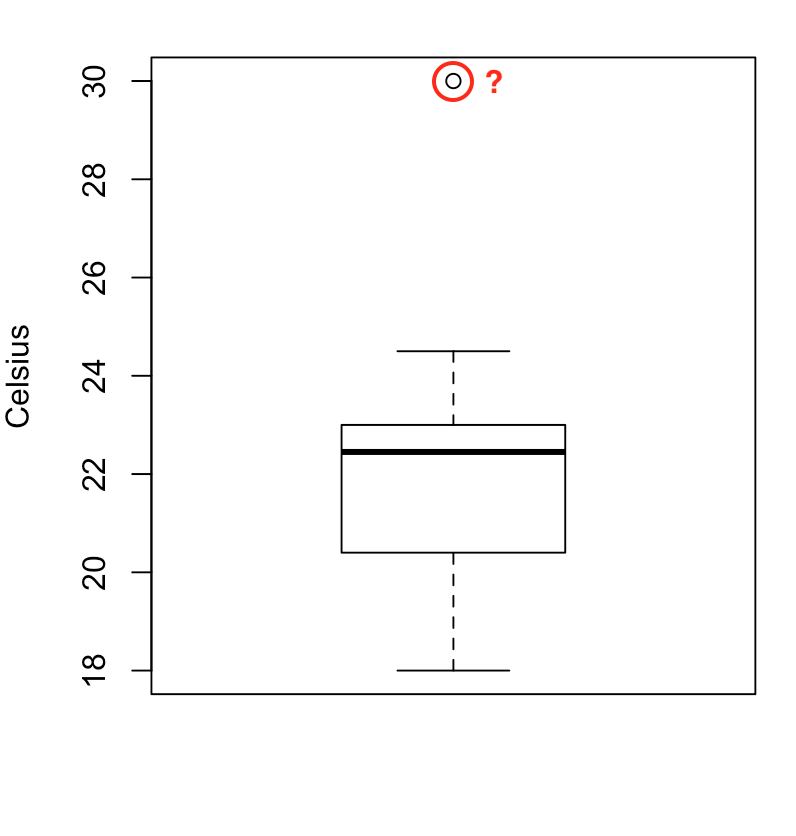
Boxplot untuk titik pencilan

Pengantar Deteksi Anomali di R

Uji Grubbs

  • Uji statistik untuk menentukan apakah sebuah titik adalah pencilan
  • Mengasumsikan data berdistribusi normal
  • Perlu memeriksa asumsi kenormalan terlebih dahulu
Pengantar Deteksi Anomali di R

Memeriksa kenormalan dengan histogram

hist(temperature, breaks = 6)
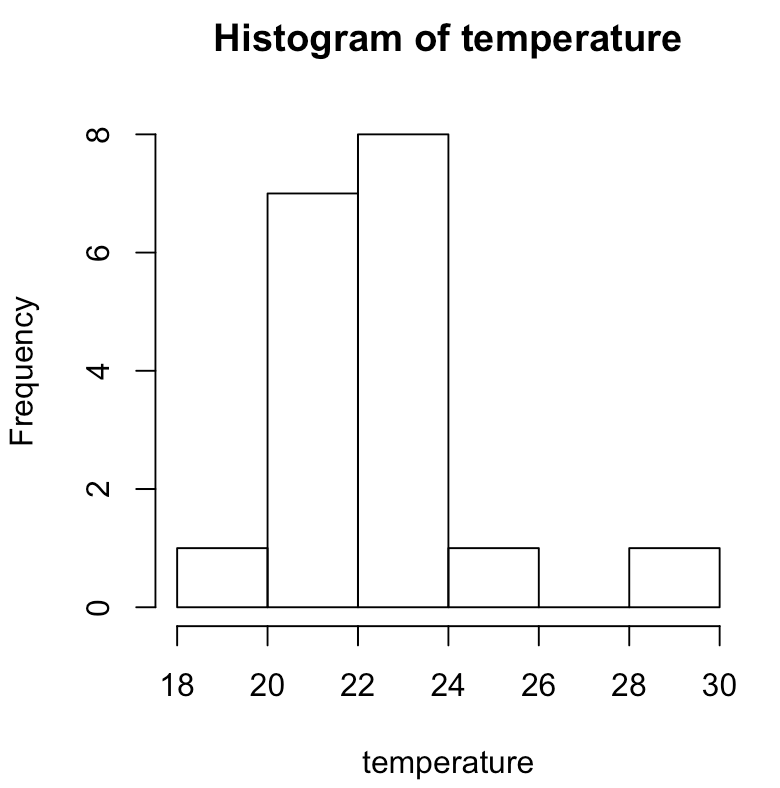
Histogram yang menunjukkan sebaran data

Simetris & berbentuk lonceng?

Pengantar Deteksi Anomali di R

Menjalankan uji Grubbs

Gunakan fungsi grubbs.test():

grubbs.test(temperature)
    Grubbs test for one outlier
data:  temp
G = 3.07610, U = 0.41065, p-value = 0.001796
alternative hypothesis: highest value 30 is an outlier
Pengantar Deteksi Anomali di R

Menafsirkan p-value

grubbs.test(temperature)
    Grubbs test for one outlier

data:  temperature
G = 3.07610, U = 0.41065, p-value = 0.001796
alternative hypothesis: highest value 30 is an outlier

  p-value

  • Mendekati 0 - bukti pencilan semakin kuat
  • Mendekati 1 - bukti pencilan semakin lemah
Pengantar Deteksi Anomali di R

Dapatkan indeks baris pencilan

Lokasi maksimum

which.max(weights)
5

Lokasi minimum

which.min(temperature)
12
Pengantar Deteksi Anomali di R

Ayo berlatih!

Pengantar Deteksi Anomali di R

Preparing Video For Download...