Mendeteksi banyak anomali pada deret waktu musiman

Pengantar Deteksi Anomali di R

Alastair Rushworth

Data Scientist

Data pendapatan bulanan

head(msales)
  sales month
1 6.068     1
2 5.966     2
3 6.133     3
4 6.230     4
5 6.407     5
6 6.433     6

Uji Grubbs tidak tepat di sini

  • Mungkin ada musiman
  • Mungkin ada banyak anomali
Pengantar Deteksi Anomali di R

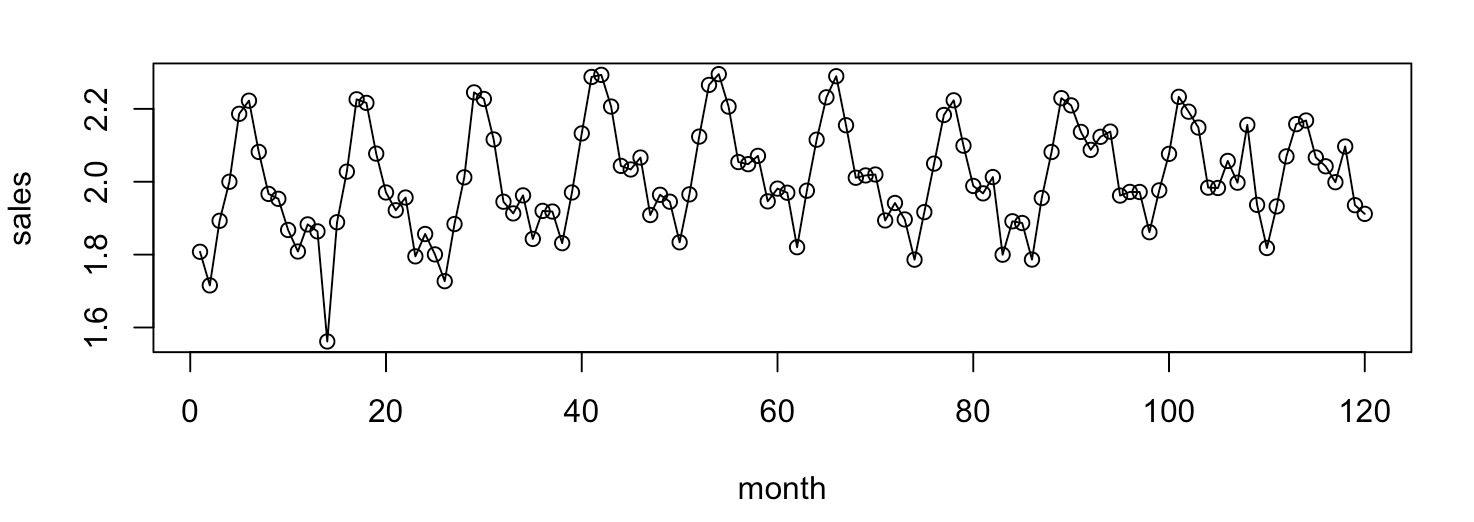
Memvisualisasikan pendapatan bulanan

plot(sales ~ month, data = msales, type = 'o')
Pengantar Deteksi Anomali di R

Pemakaian algoritme Seasonal-Hybrid ESD

library(AnomalyDetection)
sales_ad <- AnomalyDetectionVec(x = msales$sales, period = 12, 
                                direction = 'both')

Argumen

  • x: vektor nilai
  • period: periode pola berulang
  • direction: temukan anomali yang kecil ('neg'), besar ('pos'), atau keduanya ('both')

Unduh paket dari https://github.com/twitter/AnomalyDetection

Pengantar Deteksi Anomali di R

Keluaran algoritme Seasonal-Hybrid ESD

sales_ad <- AnomalyDetectionVec(x = msales$sales, period = 12, 
                                direction = 'both')
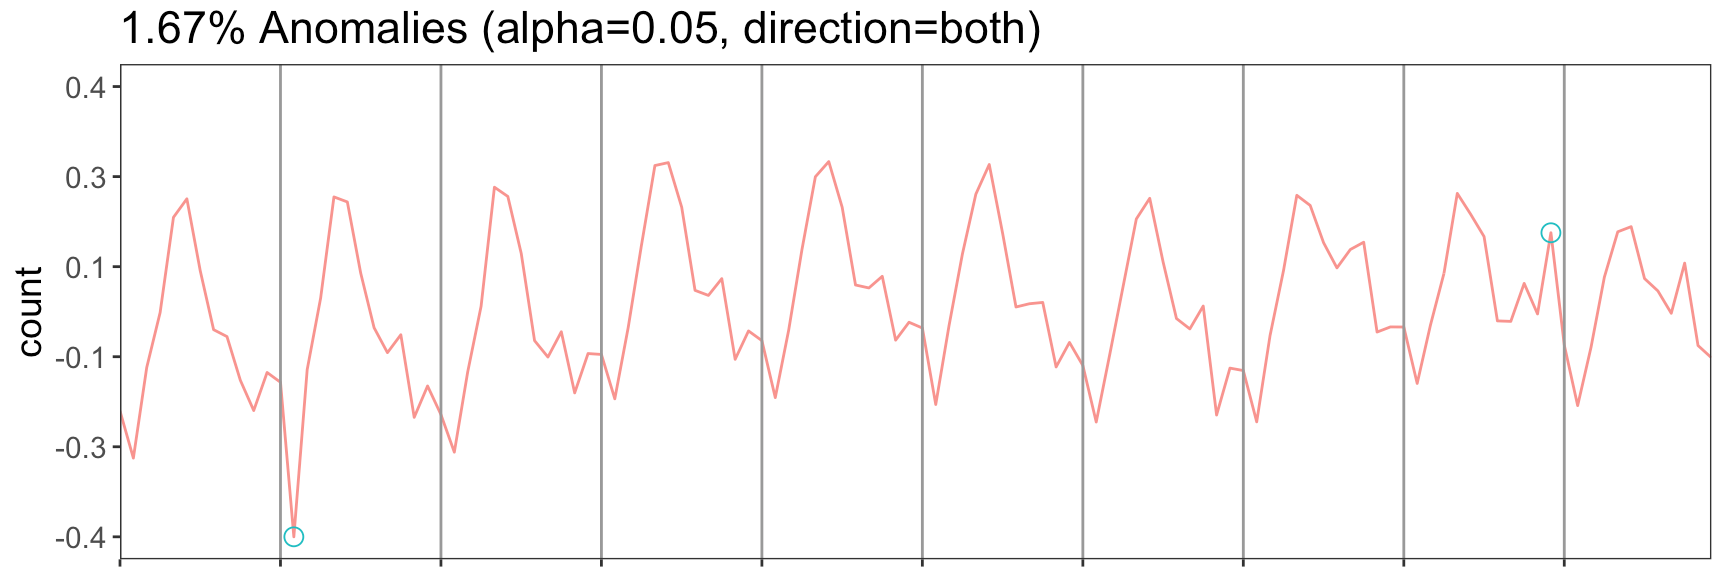
sales_ad$anoms
  index anoms
1    14 1.561
2   108 2.156
Pengantar Deteksi Anomali di R

Plot algoritme Seasonal-Hybrid ESD

AnomalyDetectionVec(x = msales$sales, period = 12, 
                    direction = 'both', plot = T)
Pengantar Deteksi Anomali di R

Ayo berlatih!

Pengantar Deteksi Anomali di R

Preparing Video For Download...