Pergeseran model
Merancang Pipeline Peramalan untuk Produksi

Rami Krispin
Senior Manager, Data Science and Engineering
Pergeseran model
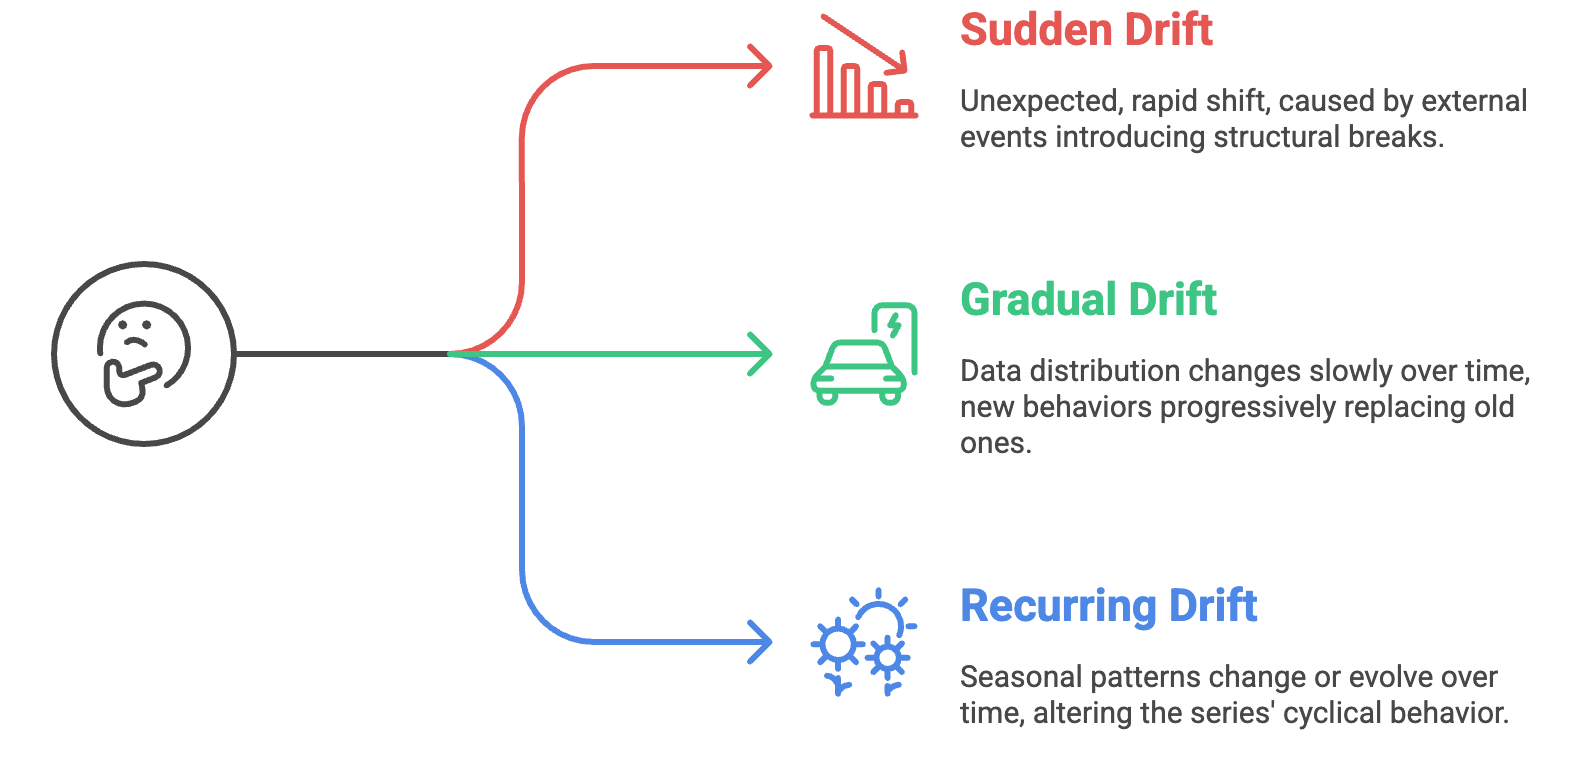
Concept drift
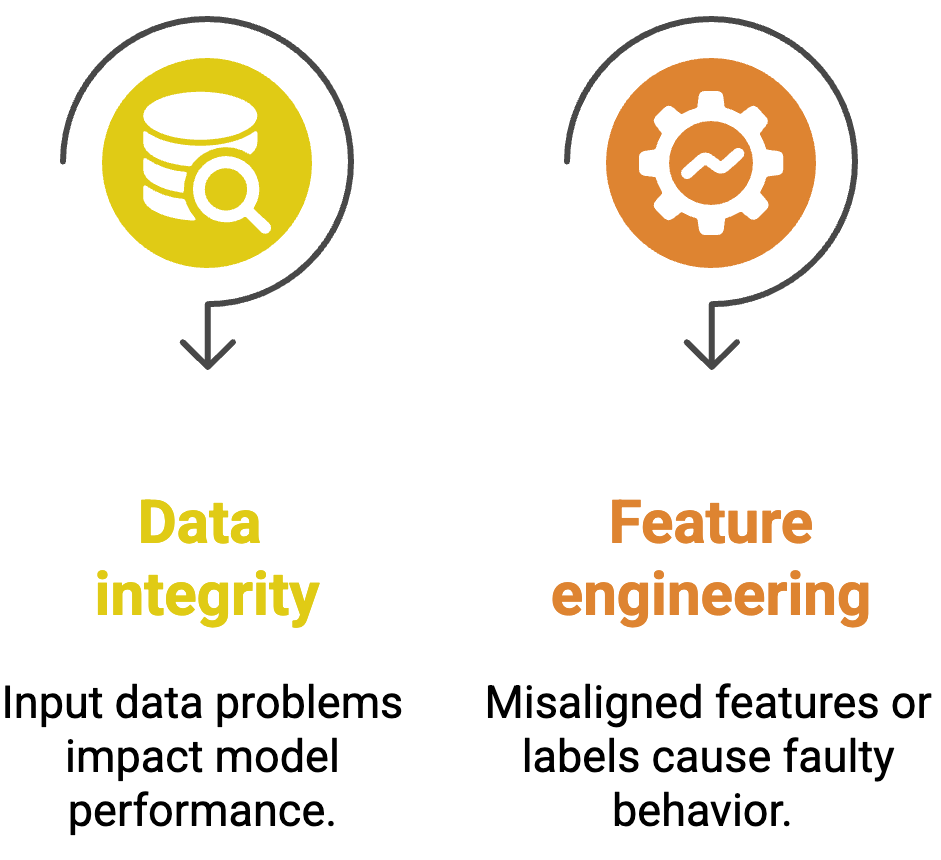
Penyebab lain pergeseran model
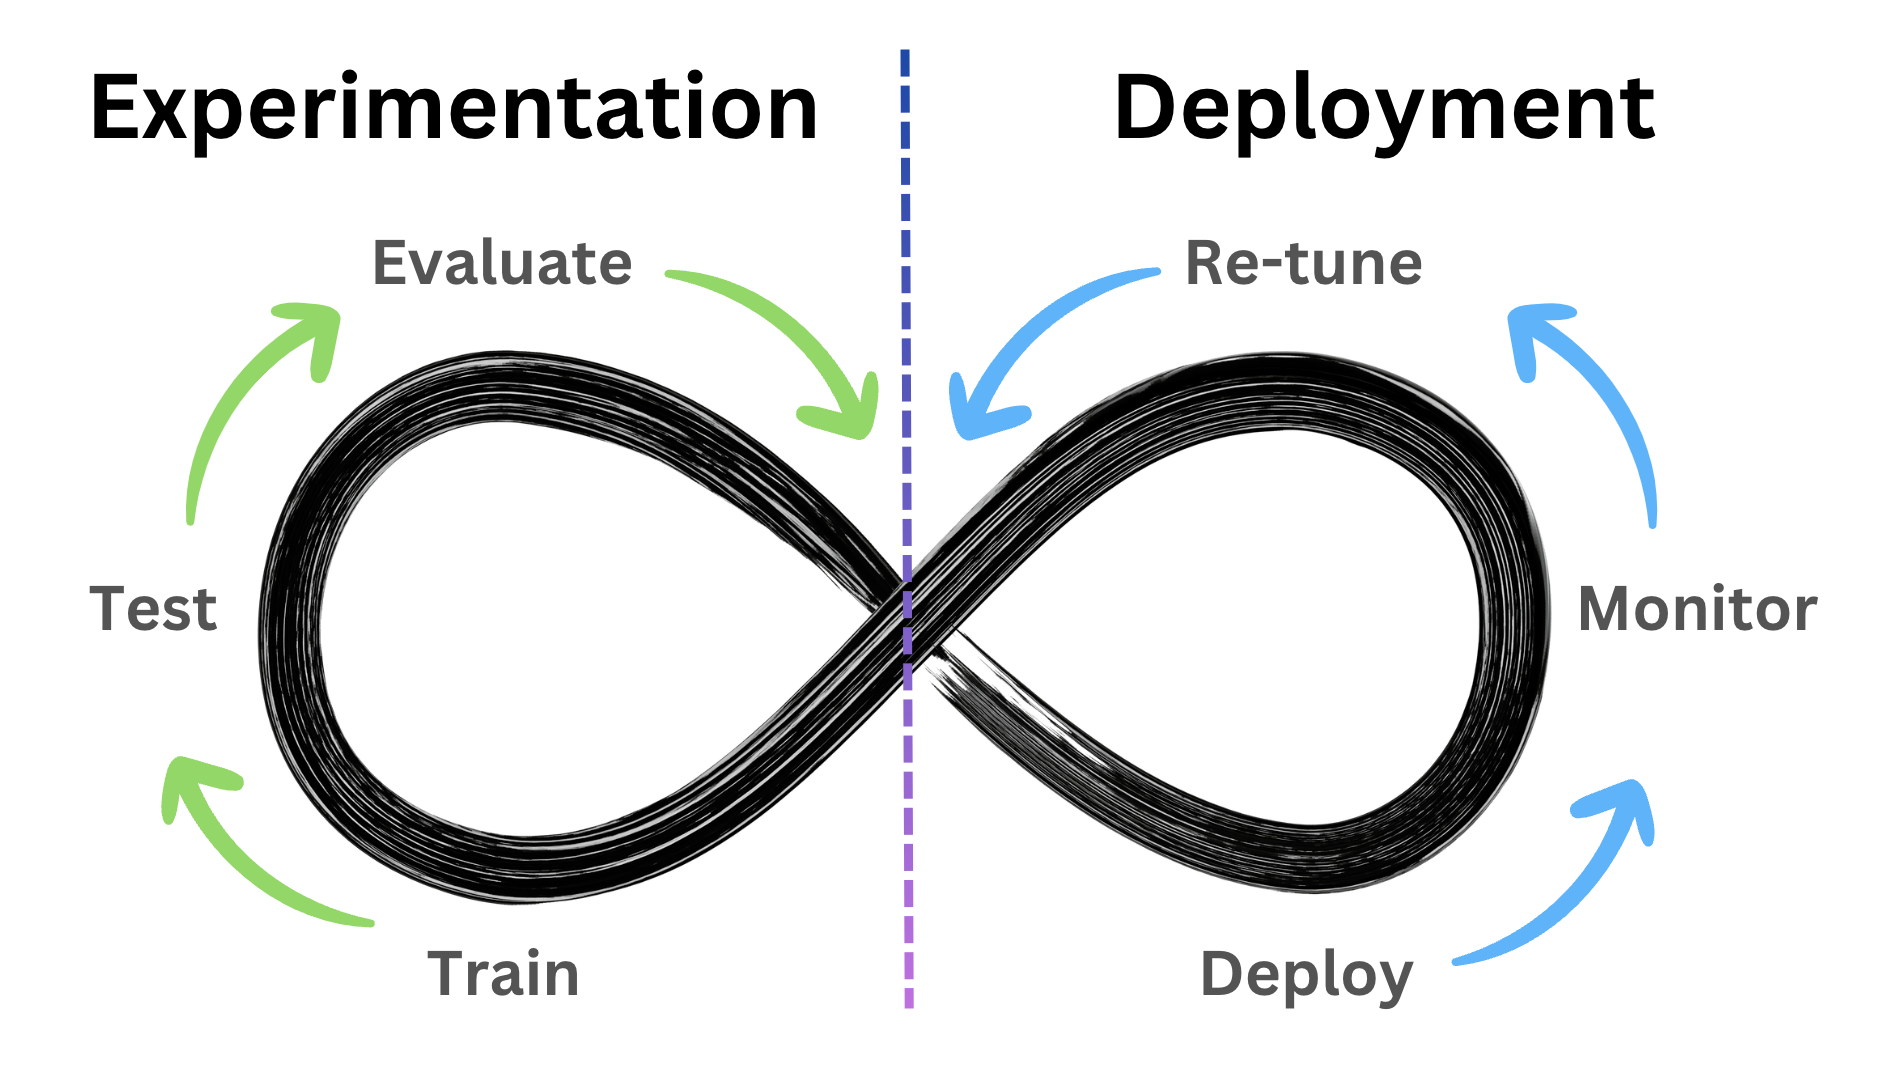
Siklus hidup model
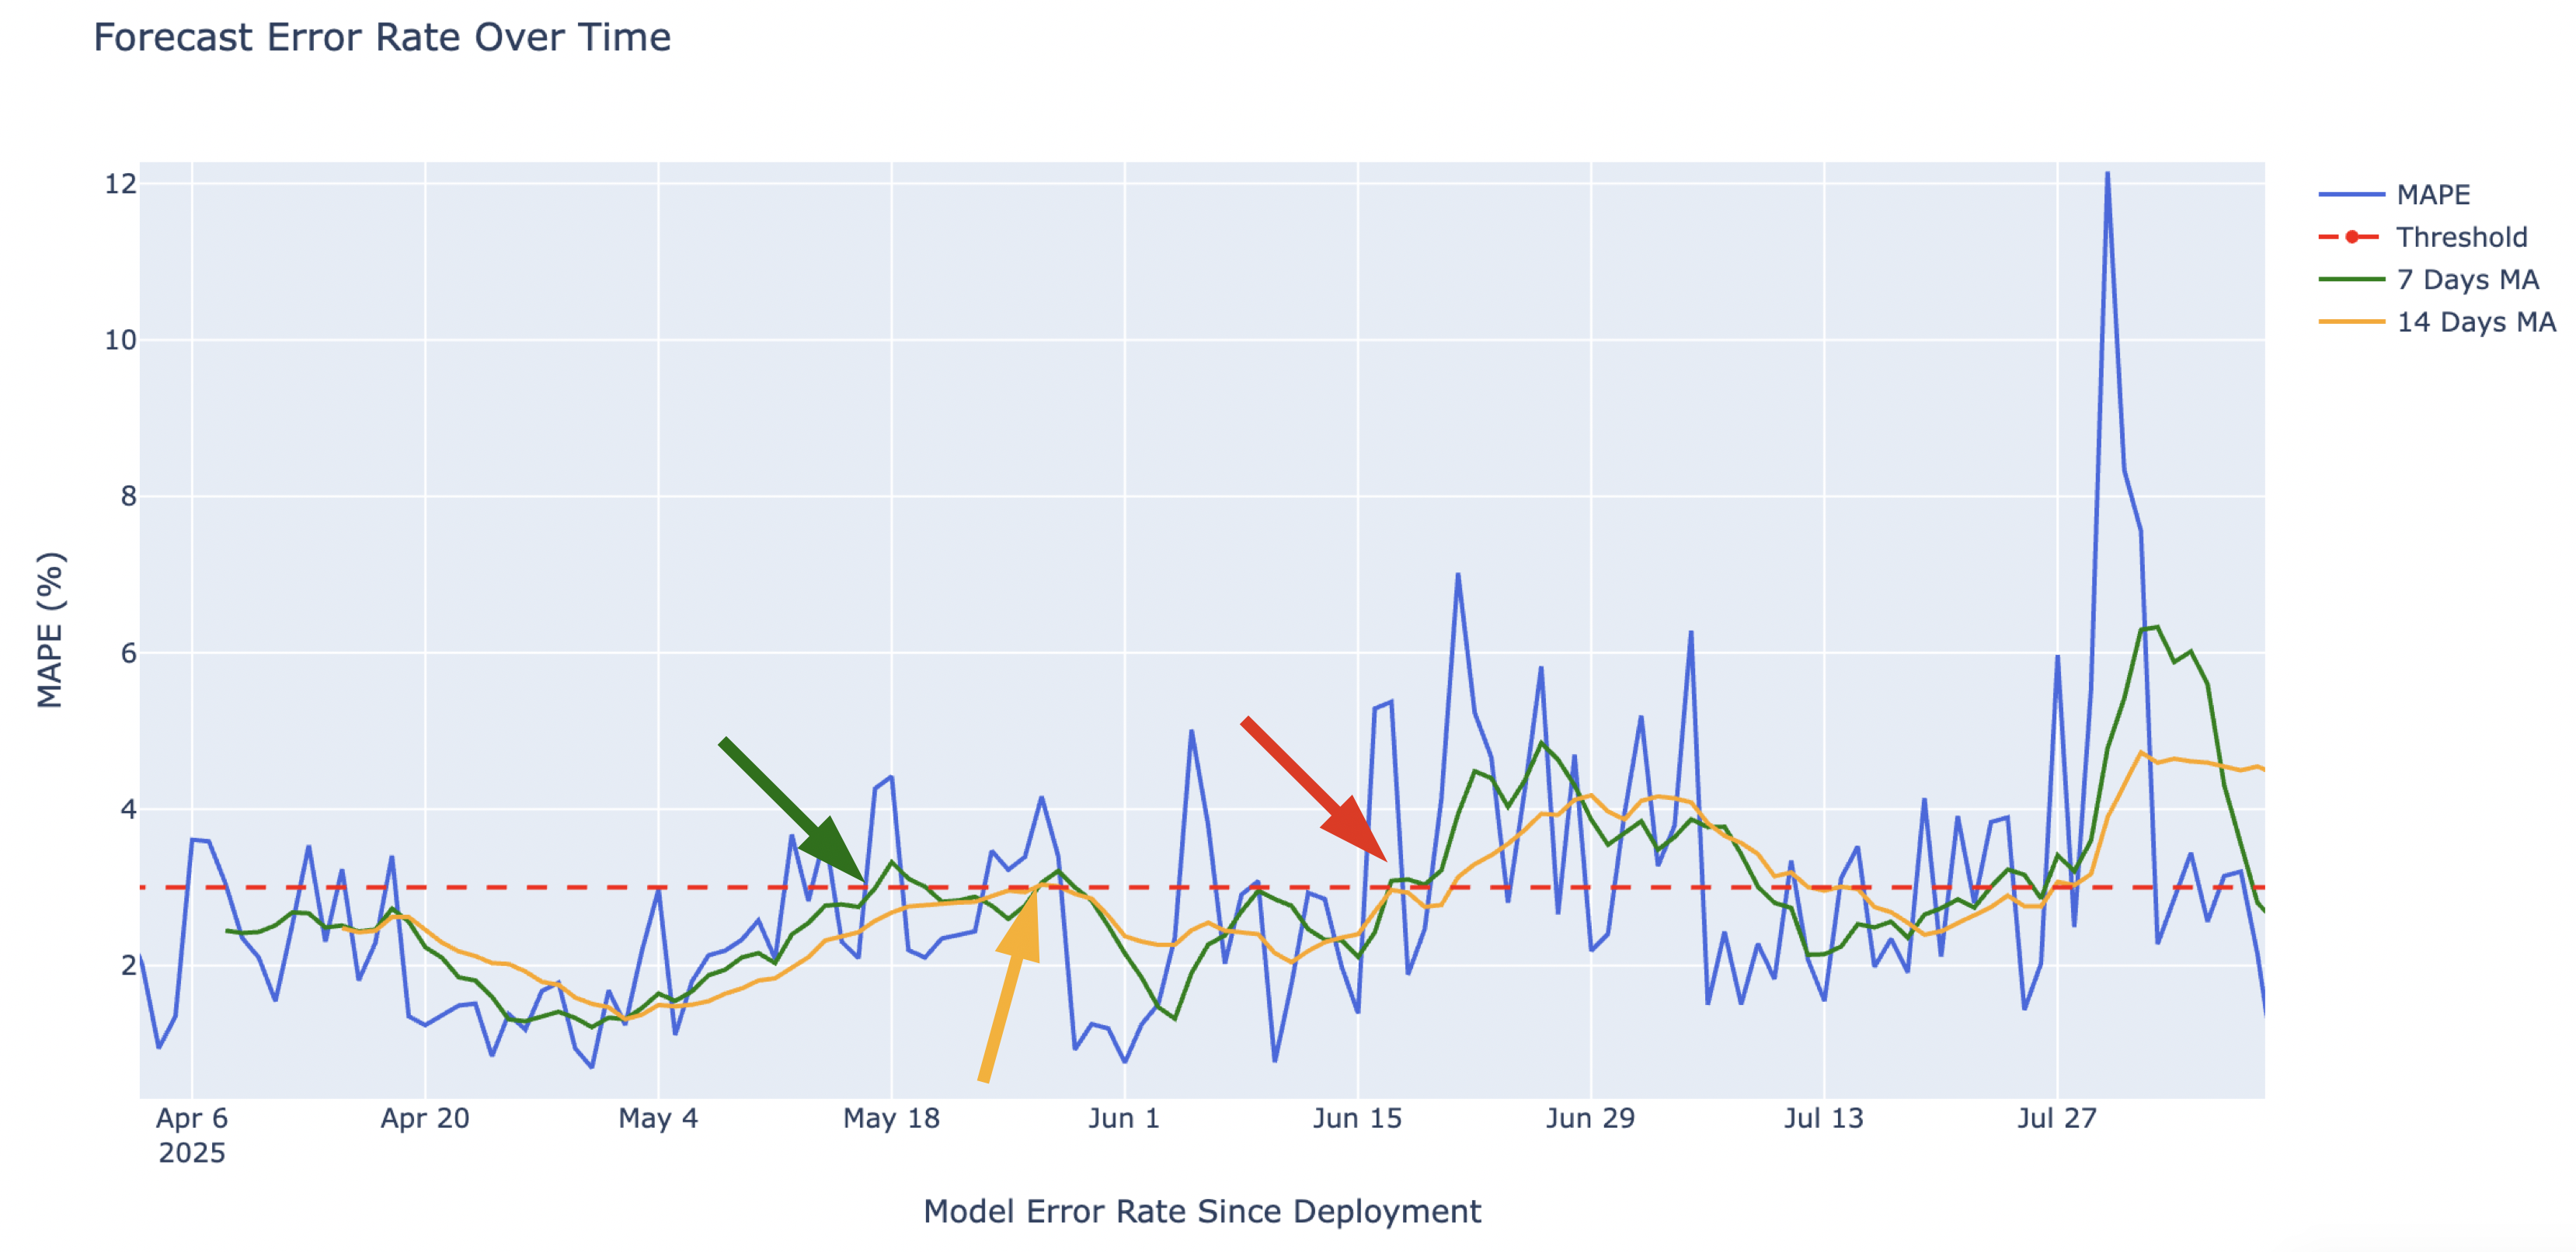
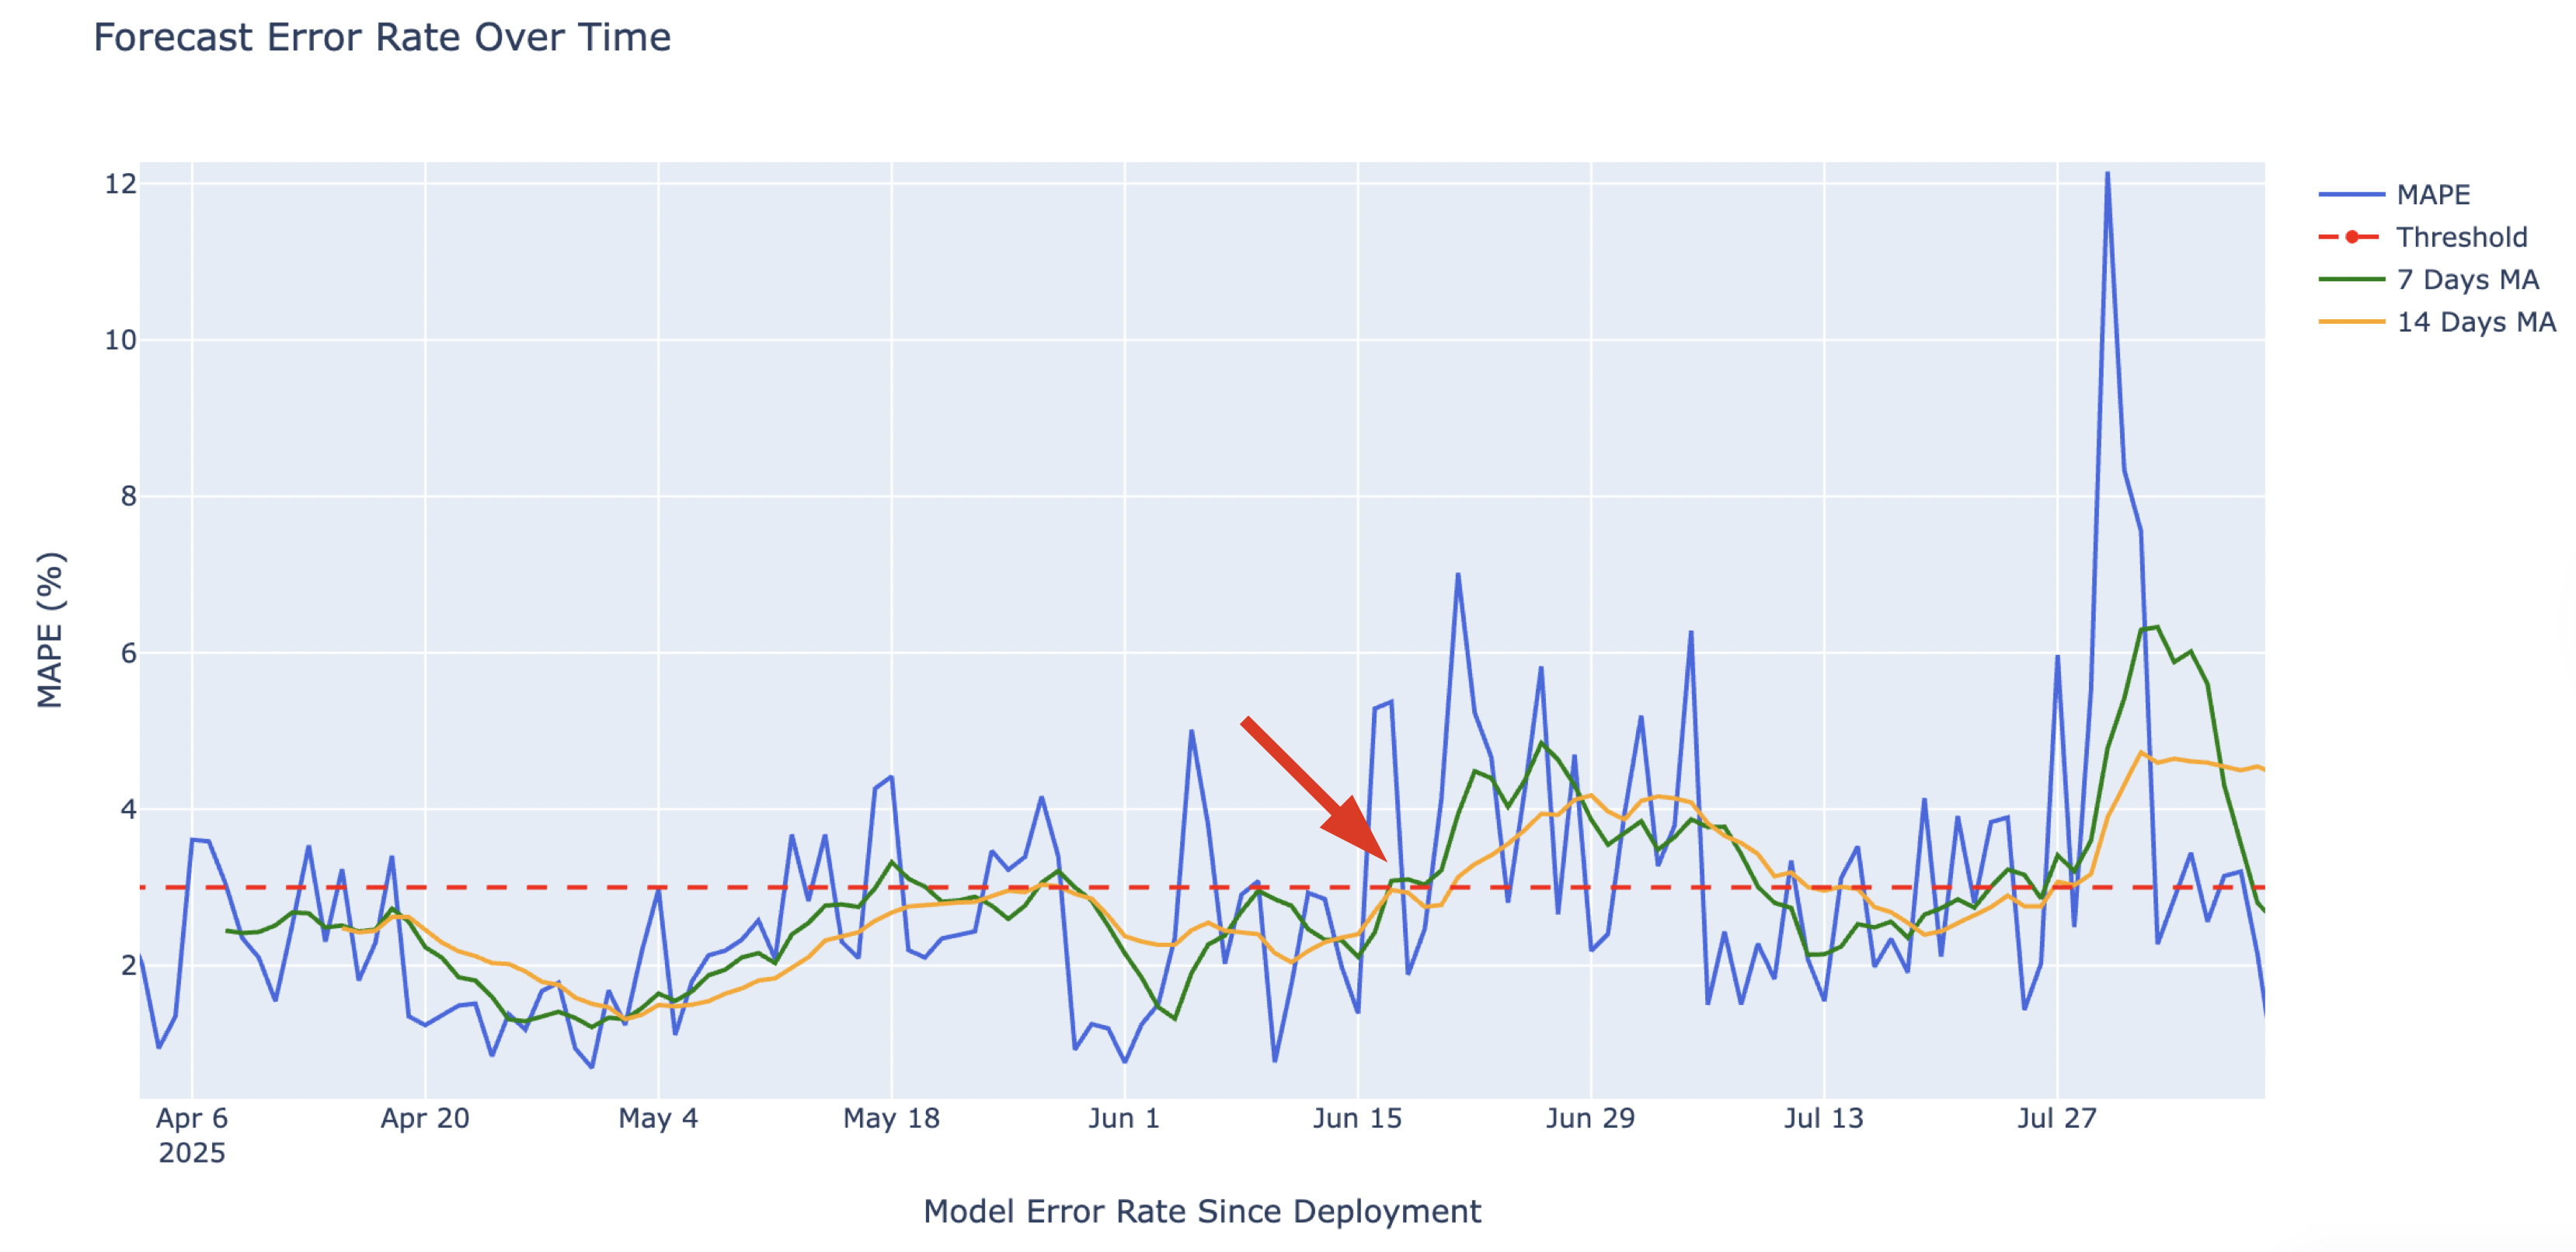
Deteksi pergeseran model
$$
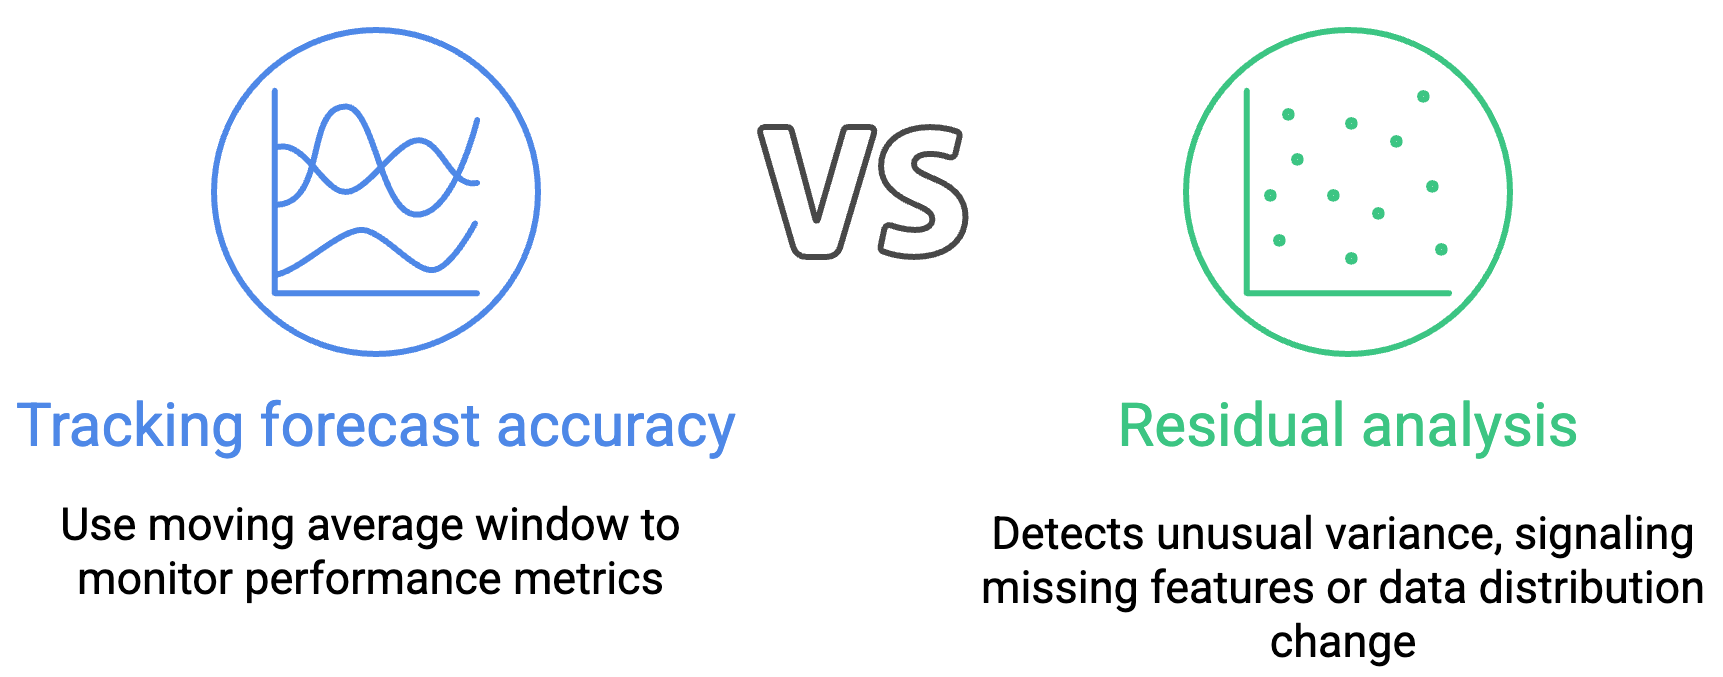
Deteksi pergeseran model
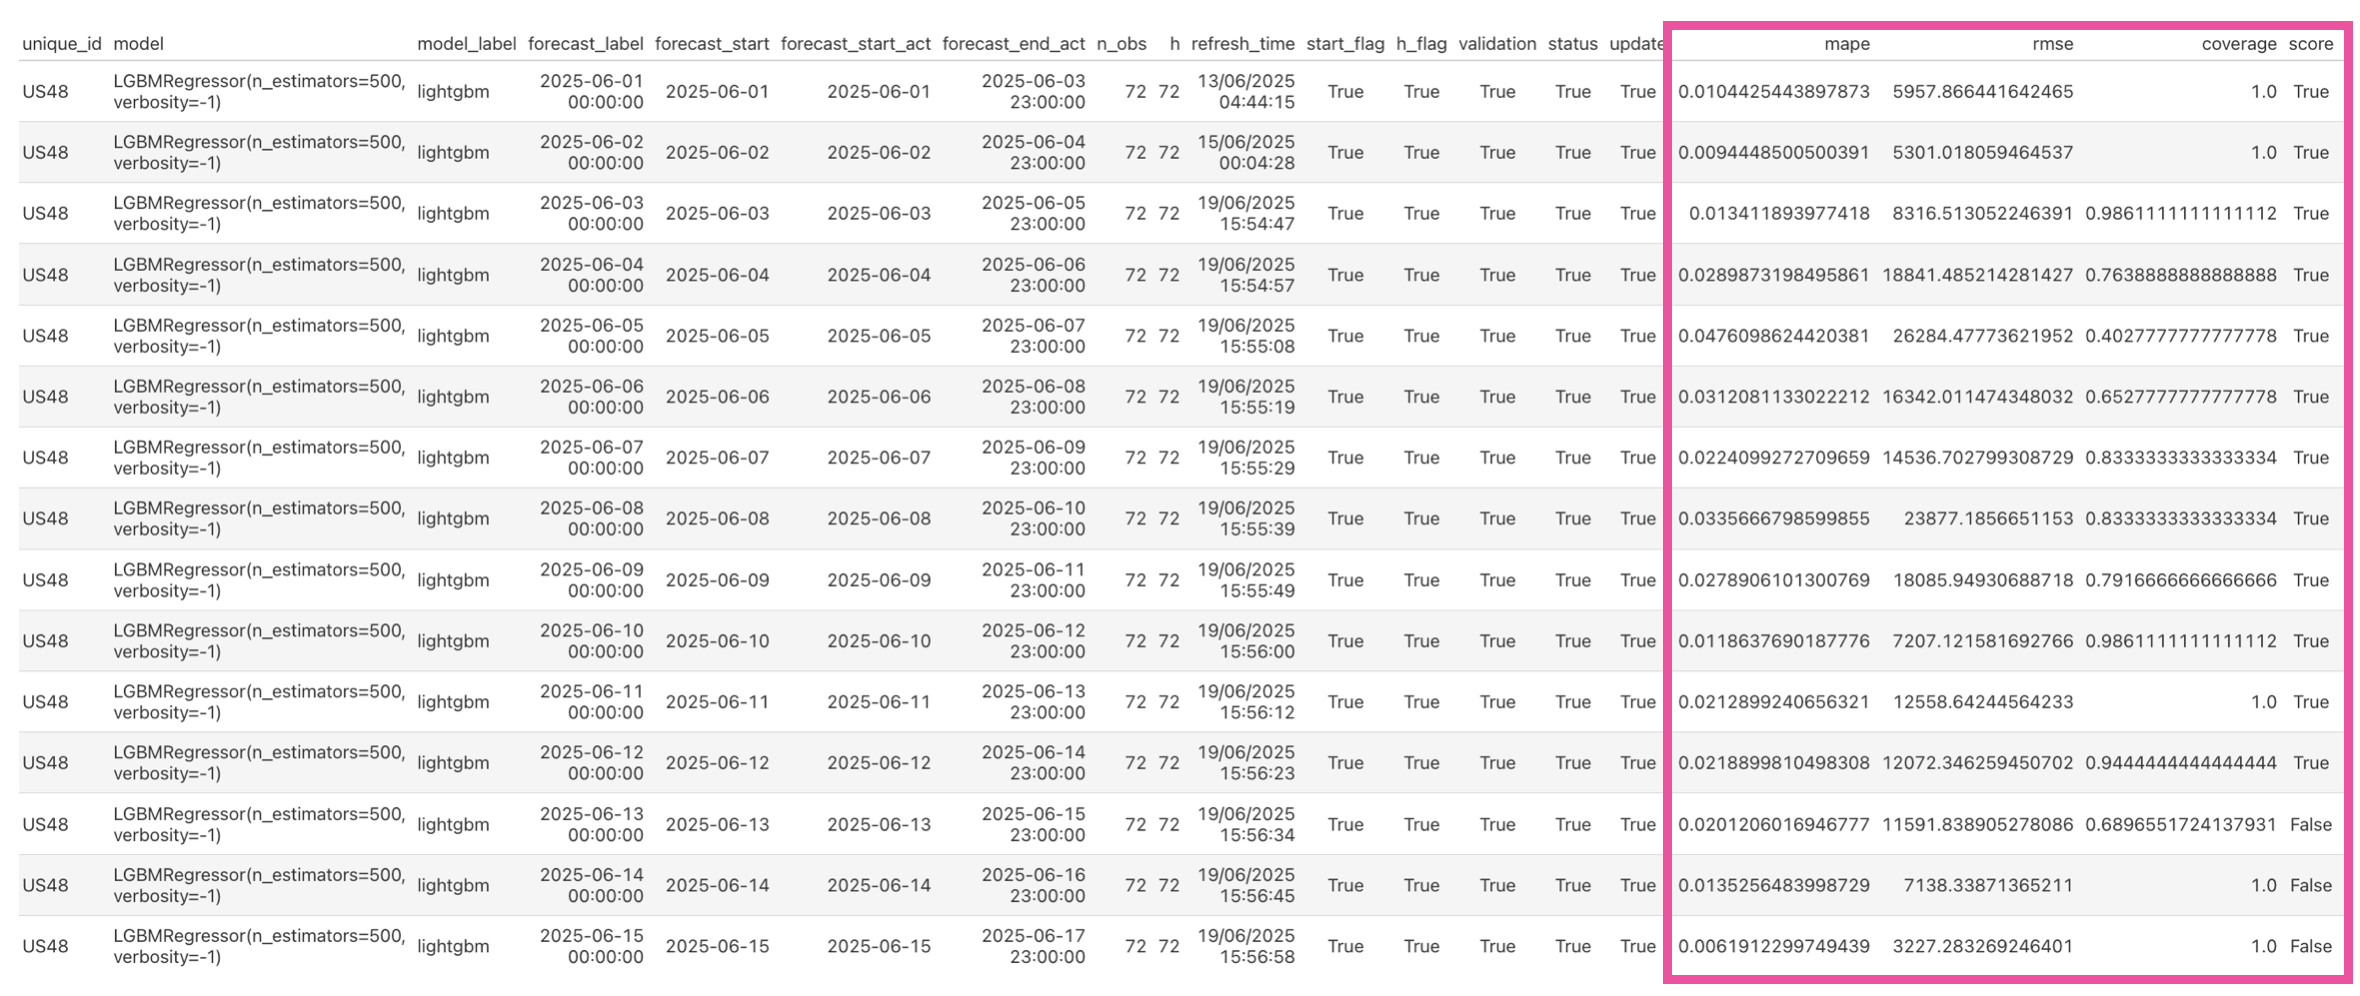
Identifikasi pergeseran
Identifikasi pergeseran
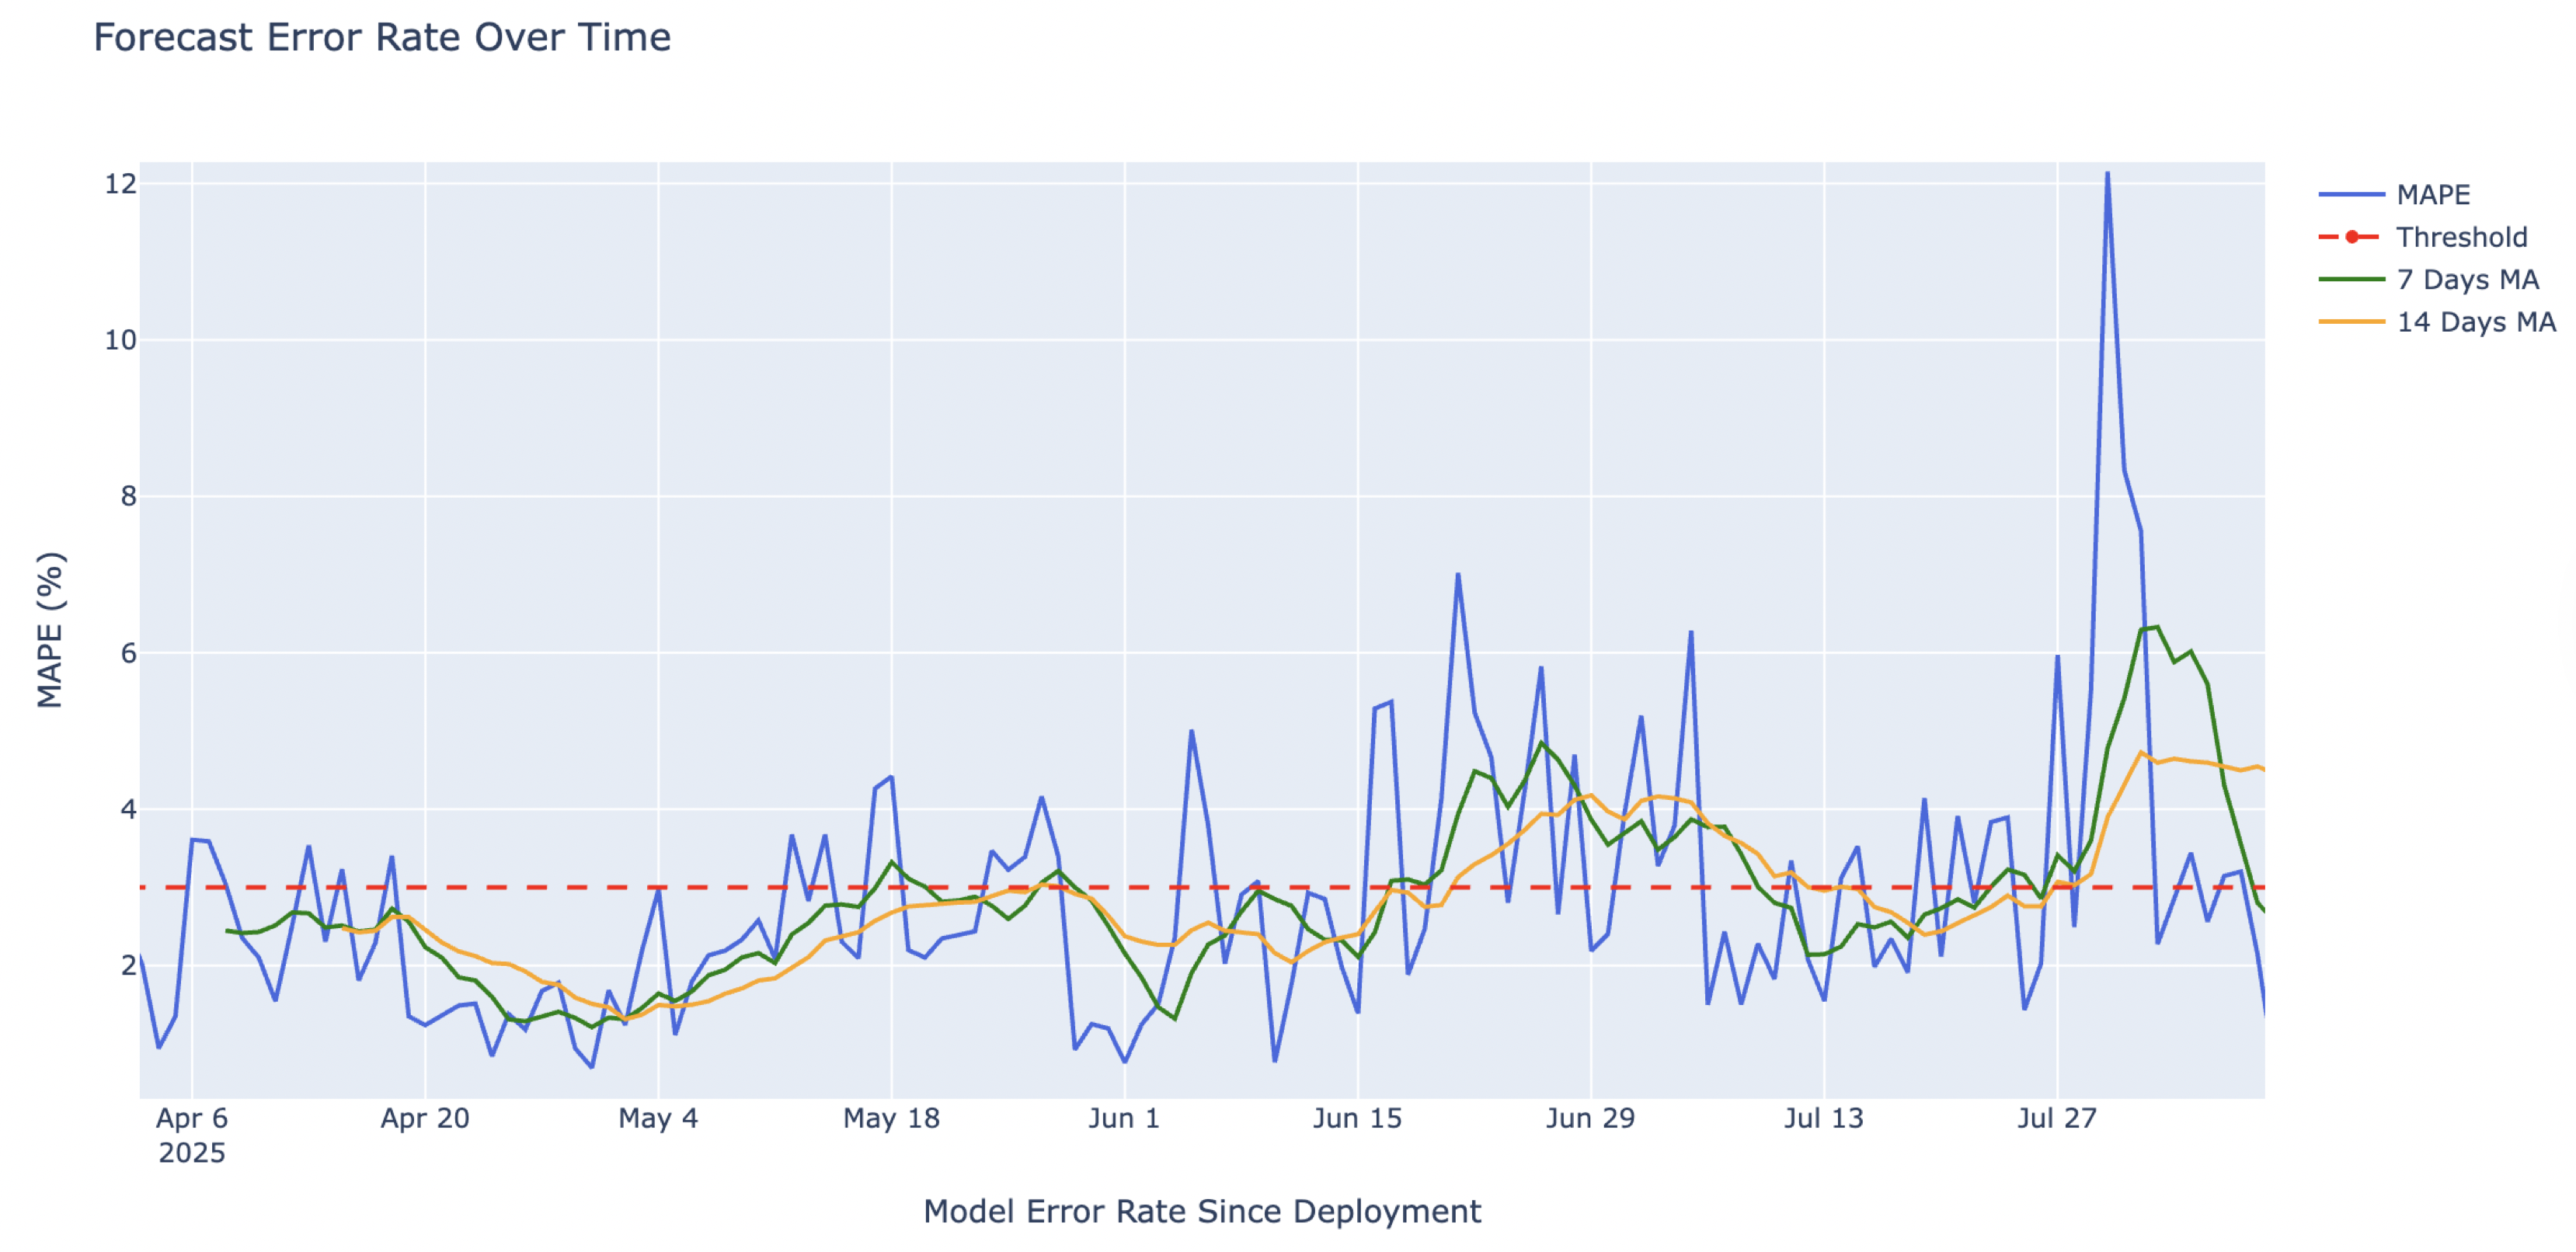
Identifikasi pergeseran
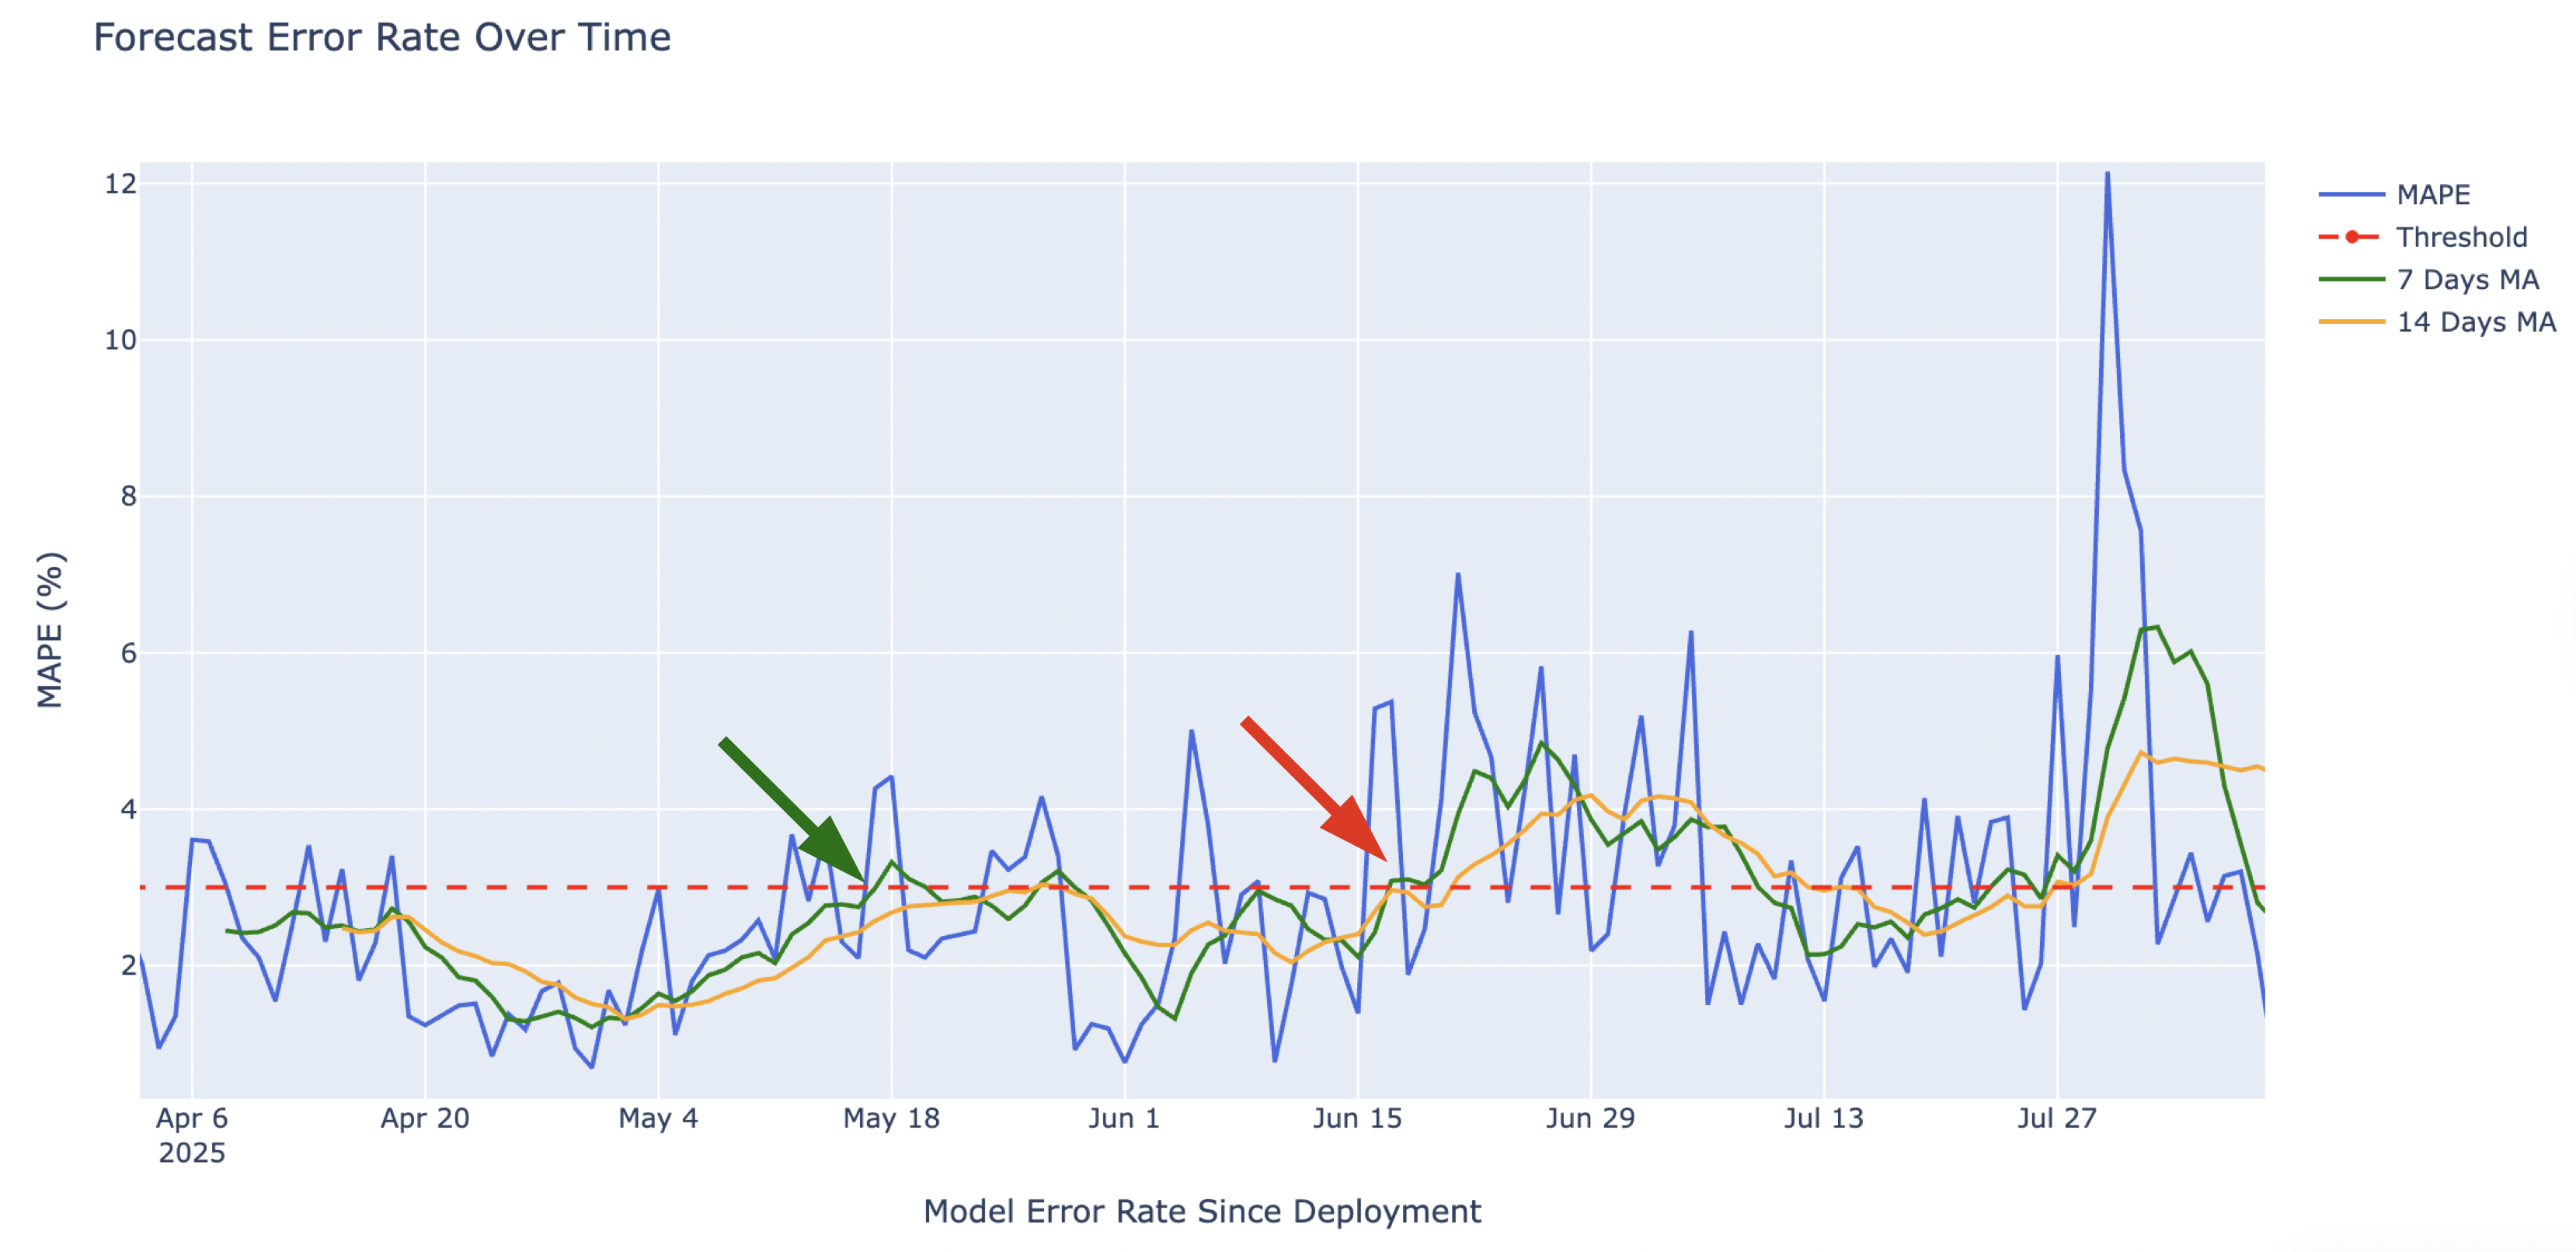
Identifikasi pergeseran