Financial returns
Introduzione alla gestione del rischio di portafoglio in Python

Dakota Wixom
Quantitative Analyst | QuantCourse.com
Financial risk
Returns
Probability
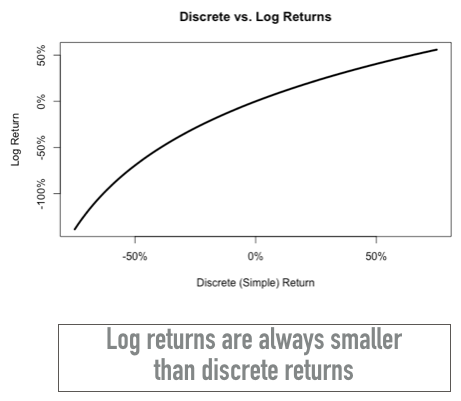
A tale of two returns
Calculating stock returns
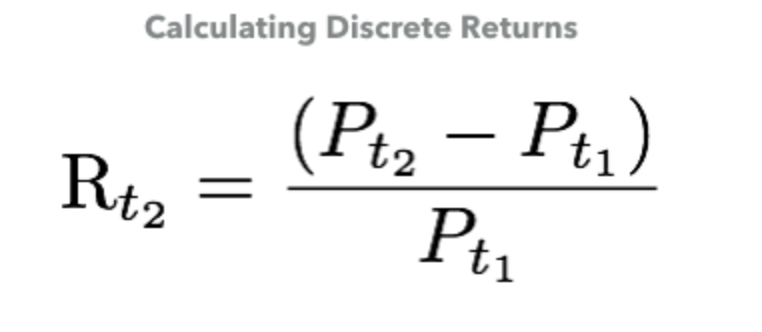
Calculating stock Returns in Python
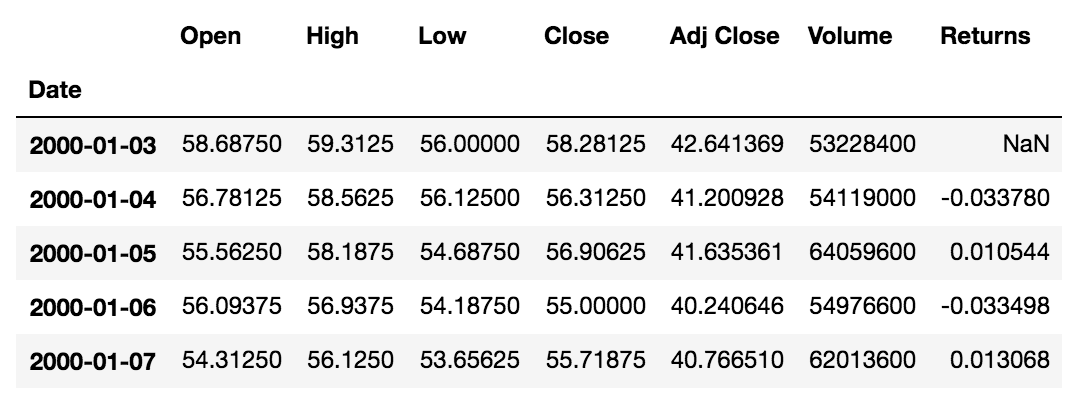
Step 2:
Calculate daily returns of the adjusted close prices and append the returns as a new column in the DataFrame.
StockPrices["Returns"] = StockPrices["Adj Close"].pct_change()
StockPrices["Returns"].head()
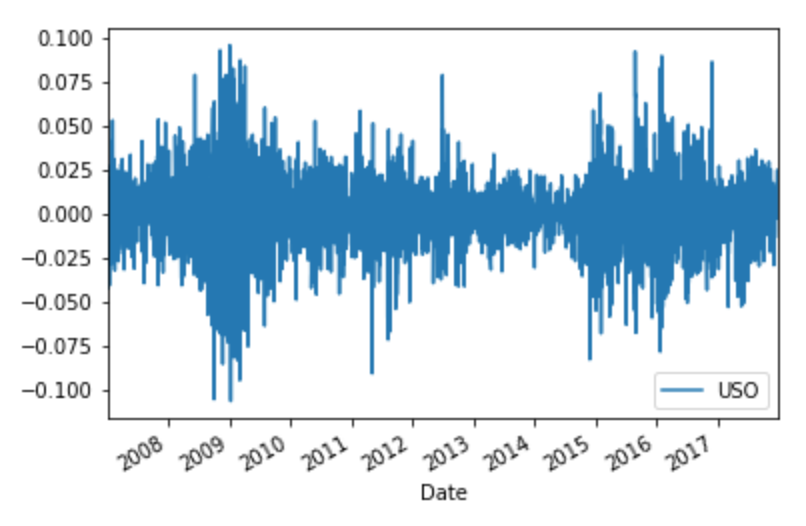
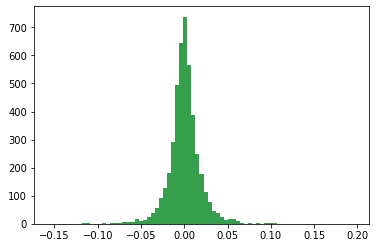
Visualizing return distributions
import matplotlib.pyplot as plt
plt.hist(StockPrices["Returns"].dropna(), bins=75, density=False)
plt.show()


