Working with more than one time series
Visualizzare dati di serie temporali in Python

Thomas Vincent
Head of Data Science, Getty Images
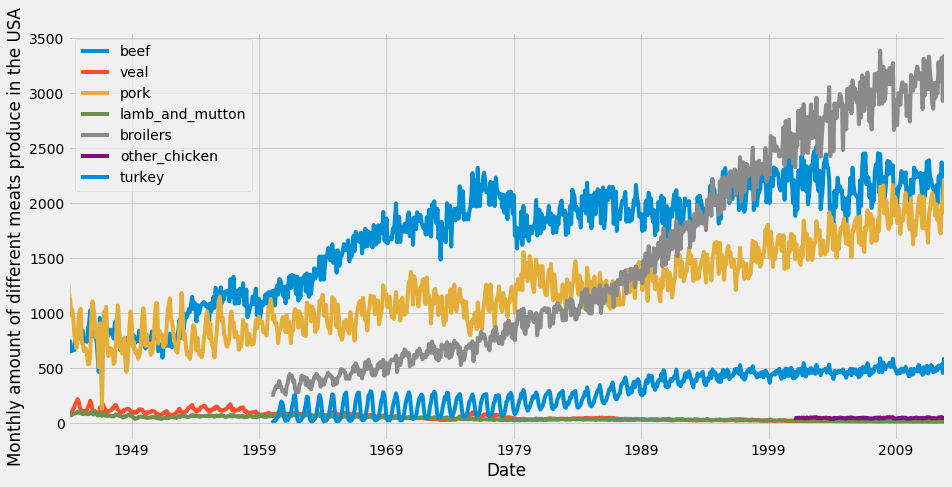
Summarizing and plotting multiple time series
import matplotlib.pyplot as plt
plt.style.use('fivethirtyeight')
ax = df.plot(figsize=(12, 4), fontsize=14)

plt.show()
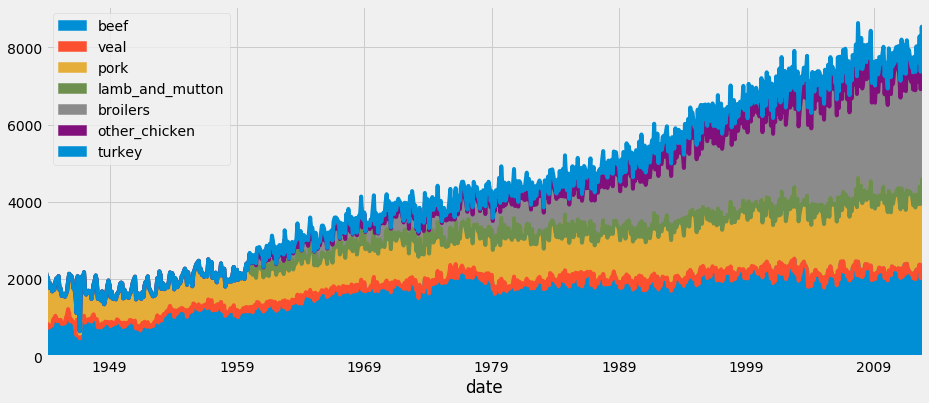
Area charts
import matplotlib.pyplot as plt
plt.style.use('fivethirtyeight')
ax = df.plot.area(figsize=(12, 4), fontsize=14)

plt.show()