EDA iniziale
Vincere una competizione Kaggle con Python

Yauhen Babakhin
Kaggle Grandmaster
Obiettivi dell'EDA
- Dimensione dei dati
- Proprietà della variabile target
- Proprietà delle feature
- Idee per il feature engineering
Two Sigma Connect: richieste per annunci di affitto
Problema
Prevedere la popolarità di un annuncio di affitto
Variabile target
interest_level
Tipo di problema
Classificazione con 3 classi: 'high', 'medium' e 'low'
Metrica
Perdita logaritmica multiclasse
EDA. Parte I
# Dimensione dei dati
twosigma_train = pd.read_csv('twosigma_train.csv')
print('Train shape:', twosigma_train.shape)

twosigma_test = pd.read_csv('twosigma_test.csv')
print('Test shape:', twosigma_test.shape)
Train shape: (49352, 11)
Test shape: (74659, 10)
EDA. Parte I
print(twosigma_train.columns.tolist())
['id', 'bathrooms', 'bedrooms', 'building_id', 'latitude', 'longitude',
'manager_id', 'price', 'interest_level']
twosigma_train.interest_level.value_counts()
low       34284
medium    11229
high       3839
EDA. Parte I
# Descrivi i dati di train
twosigma_train.describe()
         bathrooms      bedrooms      latitude     longitude         price
count  49352.00000  49352.000000  49352.000000  49352.000000  4.935200e+04
mean       1.21218      1.541640     40.741545    -73.955716  3.830174e+03
std        0.50142      1.115018      0.638535      1.177912  2.206687e+04
min        0.00000      0.000000      0.000000   -118.271000  4.300000e+01
25%        1.00000      1.000000     40.728300    -73.991700  2.500000e+03
50%        1.00000      1.000000     40.751800    -73.977900  3.150000e+03
75%        1.00000      2.000000     40.774300    -73.954800  4.100000e+03
max       10.00000      8.000000     44.883500      0.000000  4.490000e+06
EDA. Parte II
import matplotlib.pyplot as plt
plt.style.use('ggplot')
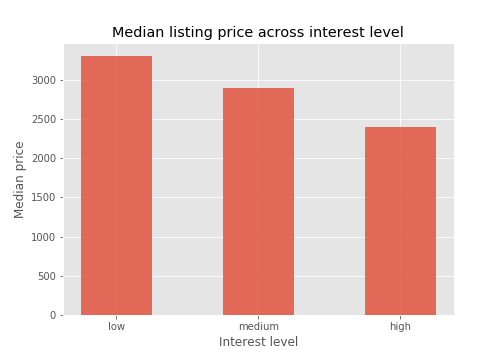
# Trova il prezzo mediano per livello di interesse
prices = twosigma_train.groupby('interest_level', as_index=False)['price'].median()
EDA. Parte II
# Disegna un barplot fig = plt.figure(figsize=(7, 5)) plt.bar(prices.interest_level, prices.price, width=0.5, alpha=0.8)# Imposta i titoli plt.xlabel('Interest level') plt.ylabel('Median price') plt.title('Median listing price across interest level')# Mostra il grafico plt.show()
Ayo berlatih!
Vincere una competizione Kaggle con Python

