Valutare l’opzione Make
Case Study: Supply Chain Analytics in Power BI

Nick Switzer
Analytics Lead
Stime interne dei costi

Costi incrementali delle attrezzature
Esempio pizza

Esempio pizza party

Altri tipi di costi make incrementali

Calcolare l’investimento richiesto
Macchine disponibili:

Macchine richieste per la produzione:
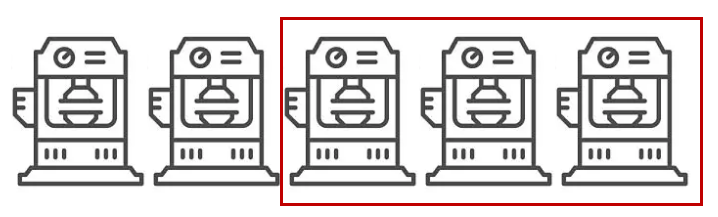
1 Machine image is from: https://www.istockphoto.com/vector/set-line-icons-of-machine-tool-robotic-industry-gm540375844-96455873?phrase=manufacturing%20equipment%20icon
Formula attrezzature necessarie
Macchine richieste per la produzione:
Formula attrezzature necessarie
Macchine richieste per la produzione:

