Riordinare i fattori

Dati categoriali nel Tidyverse

Emily Robinson

Data Scientist
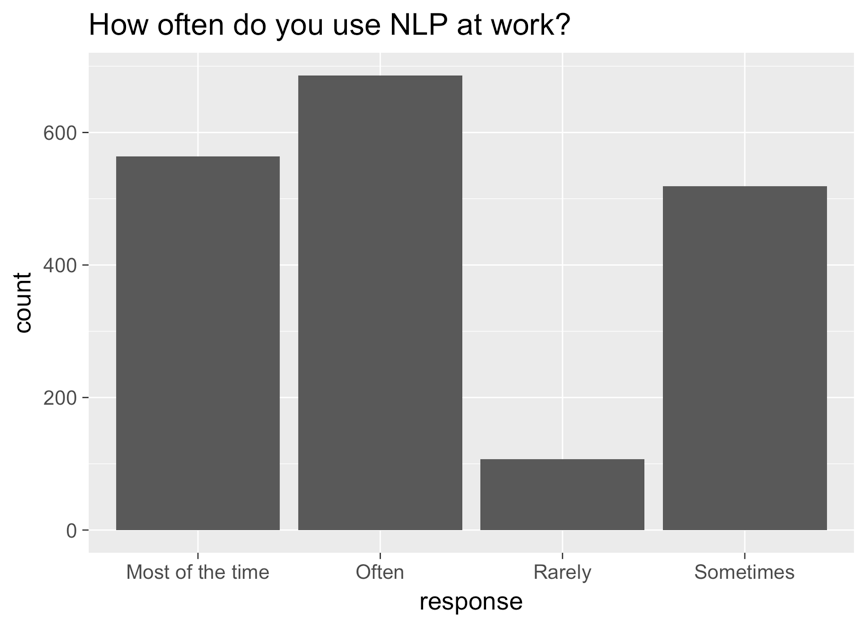
Un grafico a barre con la risposta sull'asse x, il conteggio sull'asse y e il titolo "how often do you use NLP at work?". Le barre, da sinistra a destra: most of the time, often, rarely e sometimes.

Dati categoriali nel Tidyverse

Grafico corretto

ggplot(aes(nlp_frequency, 
            x = fct_relevel(response, 
            "Rarely", "Sometimes", "Often", "Most of the time"))) + 
        geom_bar()
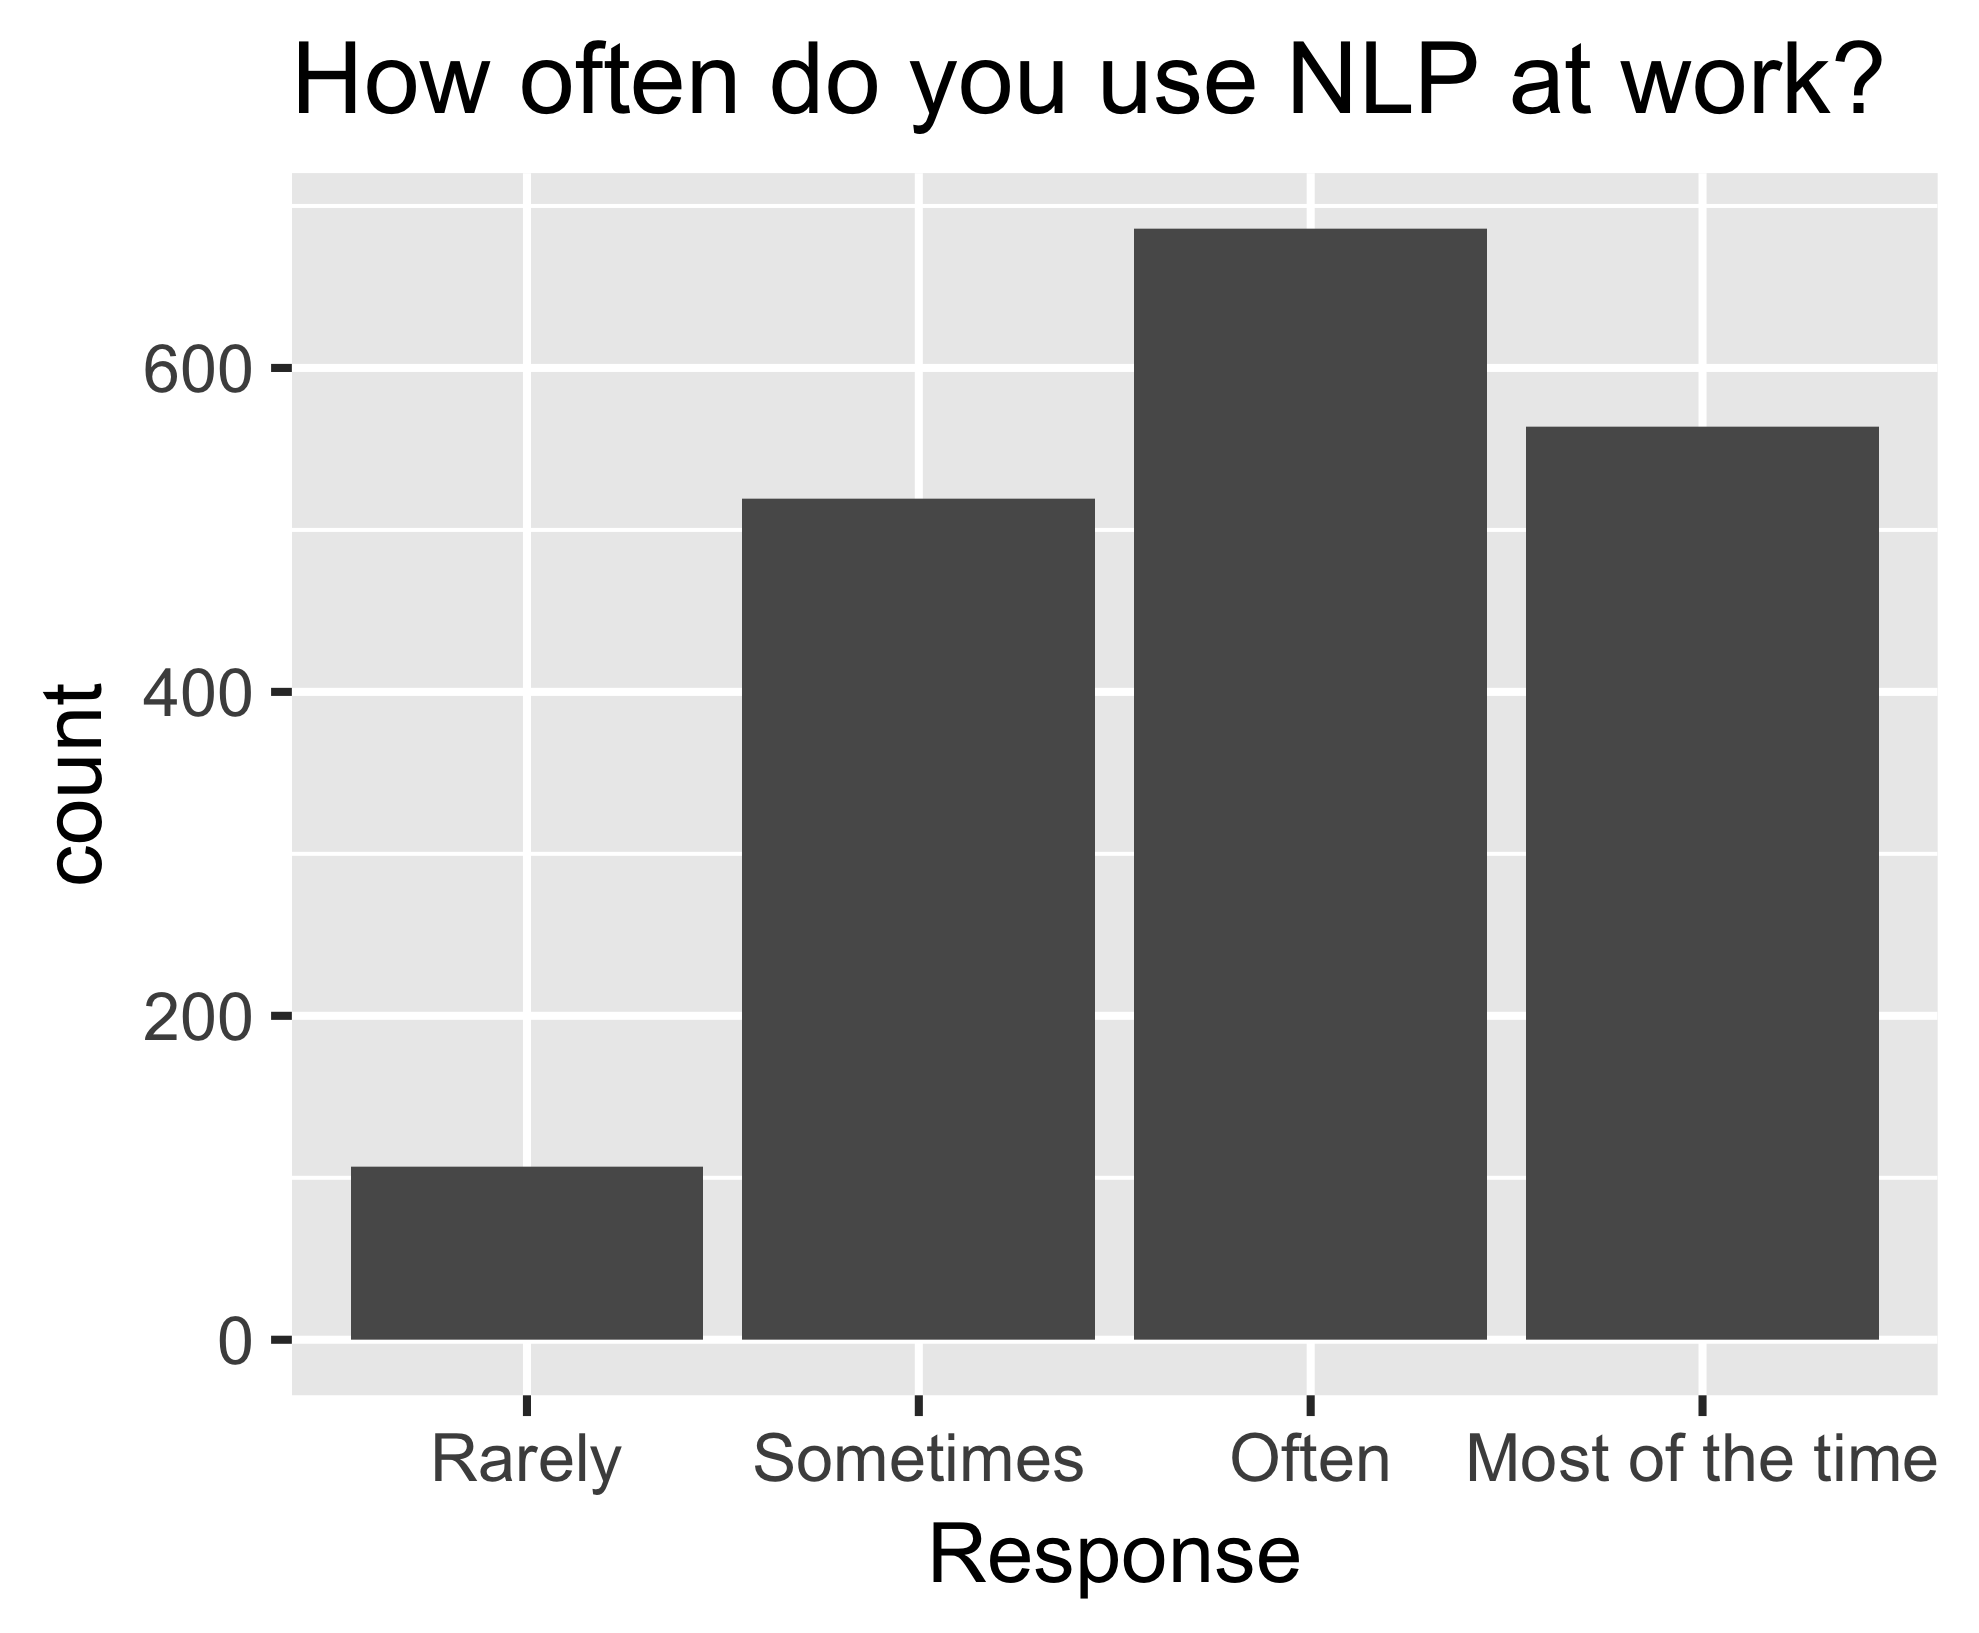
Lo stesso grafico a barre di prima, ora ordinato: da sinistra a destra, rarely, sometimes, often, most of the time.

Dati categoriali nel Tidyverse

fct_reorder()

nlp_frequency %>%
    pull(response) %>%
    levels()
[1] "Most of the time" "Often" "Rarely" "Sometimes"       
nlp_frequency %>%
    mutate(response = fct_relevel(response, 
            "Often", "Most of the time")) %>%
    pull(response) %>%
    levels()
[1] "Often" "Most of the time" "Rarely" "Sometimes"
Dati categoriali nel Tidyverse

Argomenti aggiuntivi

nlp_frequency %>%
    mutate(response = fct_relevel(response, 
            "Often", "Most of the time", after = 2)) %>%
            pull(response) %>%
            levels()
nlp_frequency %>%
    mutate(response = fct_relevel(response, 
            "Often", "Most of the time", after = Inf) %>%
    pull(response) %>%
    levels()
[1] "Rarely" "Sometimes" "Often" "Most of the time"
Dati categoriali nel Tidyverse

Esercitiamoci!

Dati categoriali nel Tidyverse

Preparing Video For Download...