Stima delle prestazioni con la cross validation
Modellazione con tidymodels in R

David Svancer
Data Scientist
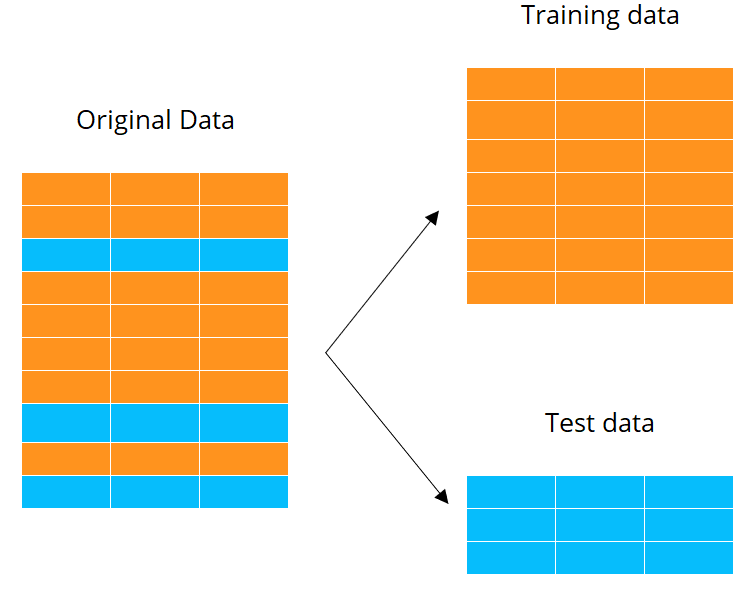
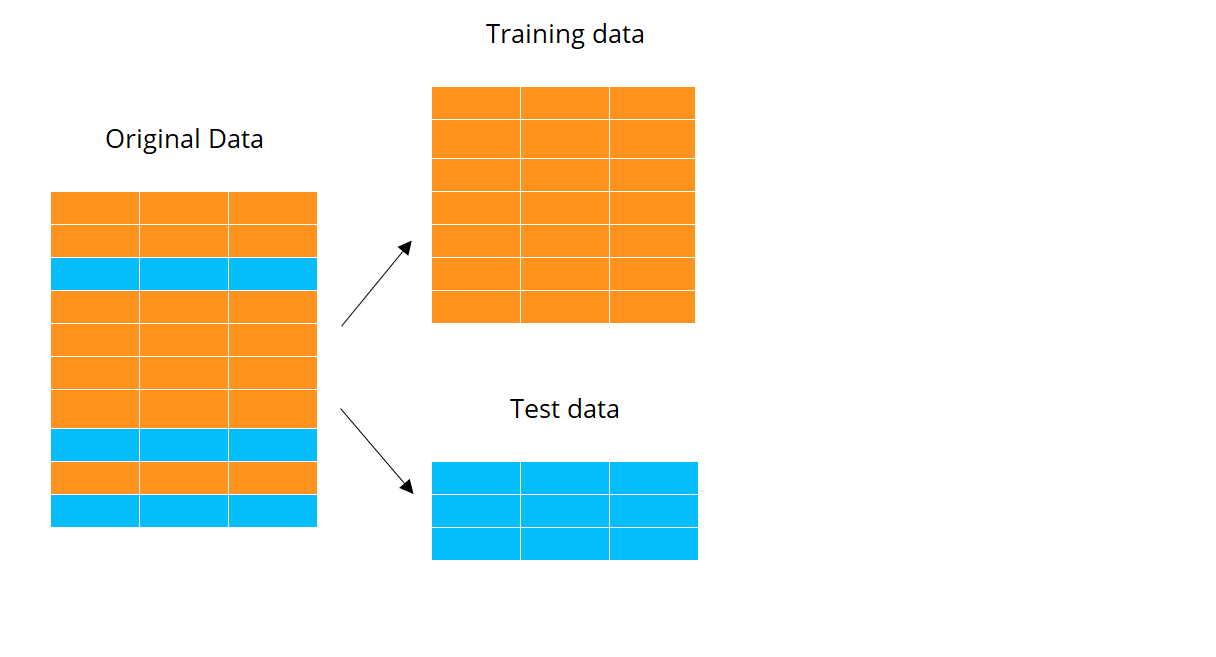
Training e test set
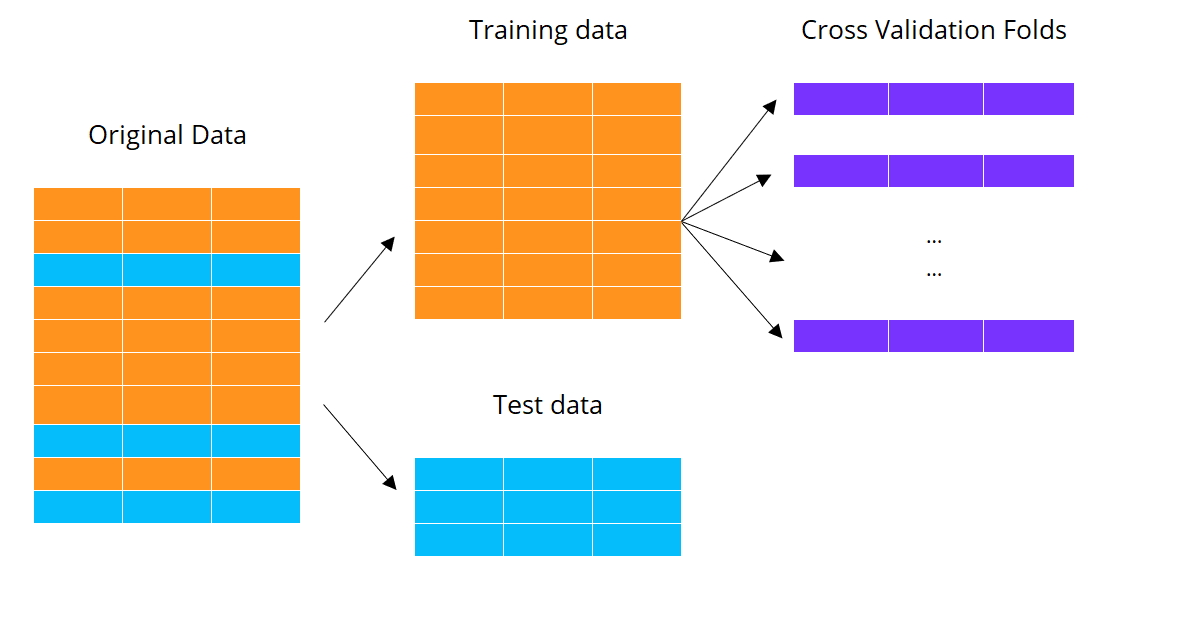
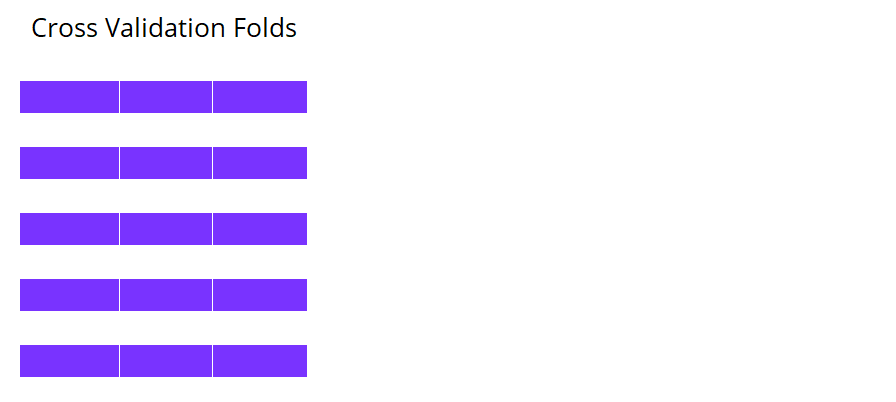
K-fold cross validation
K-fold cross validation
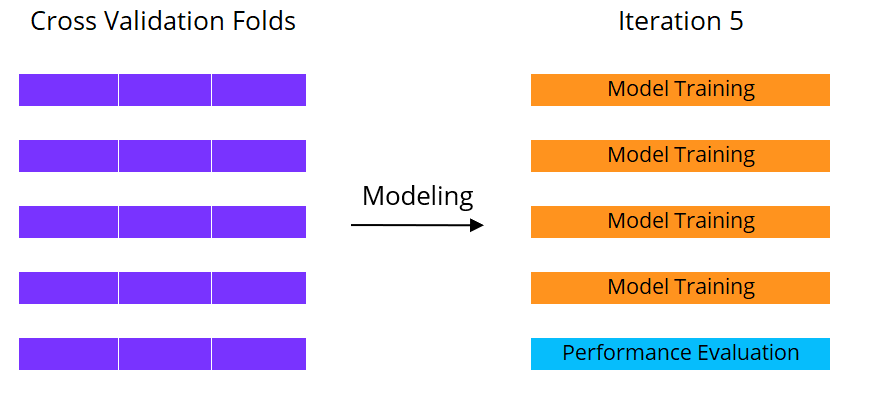
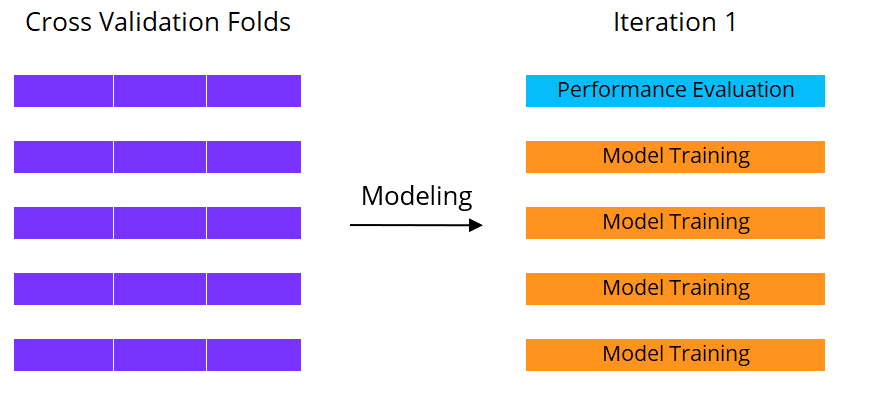
Machine learning con cross validation
Machine learning con cross validation
Machine learning con cross validation
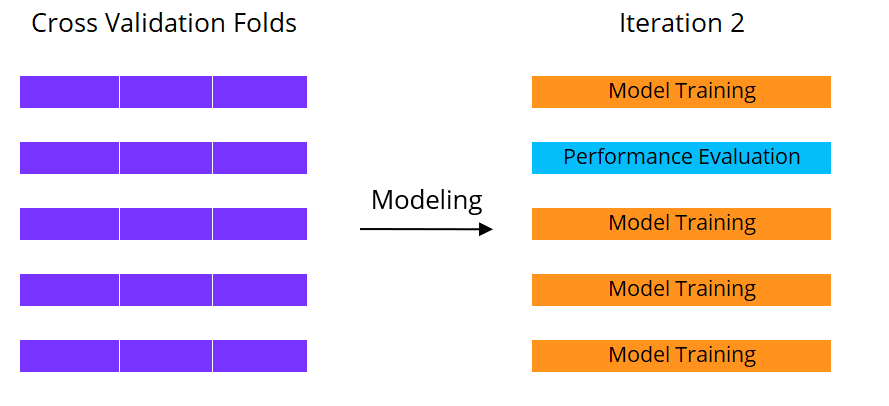
Machine learning con cross validation