Valutare l’aderenza del modello
Modellazione con tidymodels in R

David Svancer
Data Scientist
Classificazione binaria
Variabile di esito con due livelli
- Classe positiva
- Evento d’interesse da prevedere
- "yes" nella variabile
purchased
Classe negativa
- "no"
In
tidymodelsl’esito deve essere un fattore- Il primo livello è la classe positiva
- Verifica l’ordine con
levels()
leads_df
# A tibble: 1,328 x 7
  purchased total_visits  ...   us_location
   <fct>        <dbl>     ...     <fct>
 1 yes            7       ...     west
 2 no             8       ...     west
 3 no             5       ...     southeast
# ... with 1,325 more rows
levels(leads_df[['purchased']])
[1] "yes" "no"
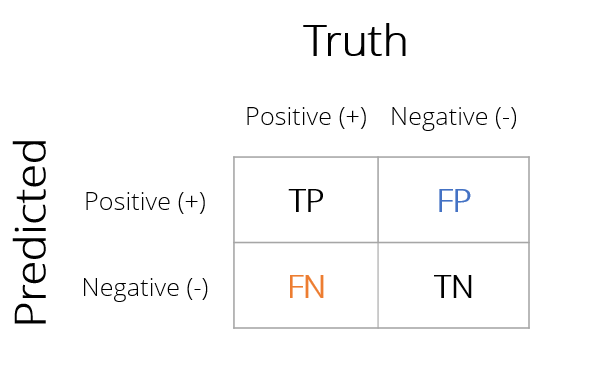
Matrice di confusione
Matrice con i conteggi di tutte le combinazioni di valori reali e previsti
Previsioni corrette
- True Positive (TP)
- True Negative (TN)
Errori di classificazione
- False Positive (FP)
- False Negative (FN)
Metriche di classificazione con yardstick
Creare matrici di confusione e altre metriche con yardstick
- Richiede un tibble di risultati del modello che contenga:
- Valori reali dell’esito
purchased
- Categorie previste
.pred_class
- Probabilità stimate per ciascuna categoria
.pred_yes.pred_no
- Valori reali dell’esito
leads_results
# A tibble: 332 x 4
   purchased .pred_class .pred_yes .pred_no
   <fct>     <fct>           <dbl>    <dbl>
 1 no        no             0.134     0.866
 2 yes       yes            0.729     0.271
 3 no        no             0.133     0.867
 4 no        no             0.0916    0.908
 5 yes       yes            0.598     0.402
 6 no        no             0.128     0.872
 7 yes       no             0.112     0.888
 8 no        no             0.169     0.831
 9 no        no             0.158     0.842
10 yes       yes            0.520     0.480
# ... with 322 more rows
Matrice di confusione con yardstick
La funzione conf_mat()
- Tibble con i risultati del modello
truth- colonna con gli esiti realiestimate- colonna con le previsioni
Regressione logistica su leads_df
- 252 su 332 clienti classificati correttamente (76%)
- 46 falsi negativi
- 34 falsi positivi
conf_mat(leads_results,truth = purchased,estimate = .pred_class)
Truth
Prediction yes no
yes 74 34
no 46 178
Accuratezza di classificazione
La funzione accuracy()
- Stessi argomenti di
conf_mat() - Calcola l’accuratezza di classificazione
$$\frac{TP + TN}{TP + TN + FP + FN}$$
- Le funzioni di
yardstickrestituiscono sempre un tibble.metric- tipo di metrica.estimate- valore calcolato
accuracy(leads_results,
truth = purchased,
estimate = .pred_class)
# A tibble: 1 x 3
.metric .estimator .estimate
<chr> <chr> <dbl>
1 accuracy binary 0.759
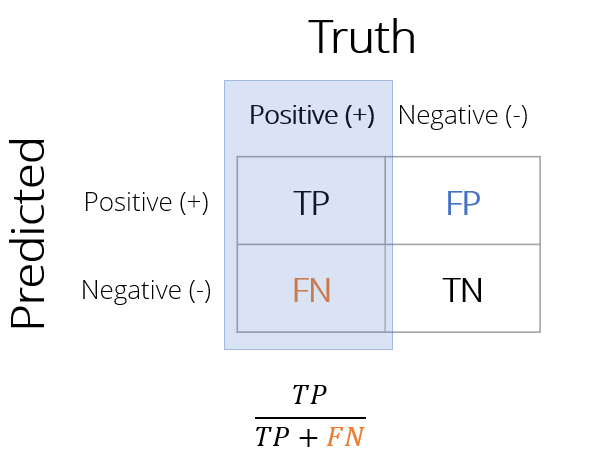
Sensibilità
Spesso l’accuratezza non è la metrica migliore
- Dati
leads_df- Classificare tutti come "no" dà 64% di accuratezza
Sensibilità
Quota dei positivi correttamente classificati
- Dei clienti che hanno acquistato, quale quota il modello ha previsto correttamente?
- Meno falsi negativi ⇒ sensibilità più alta
Calcolare la sensibilità
La funzione sens()
- Stessi argomenti di
conf_mat()eaccuracy() - Restituisce la sensibilità nella colonna
.estimate
sens(leads_results,
truth = purchased,
estimate = .pred_class)
# A tibble: 1 x 3
.metric .estimator .estimate
<chr> <chr> <dbl>
1 sens binary 0.617
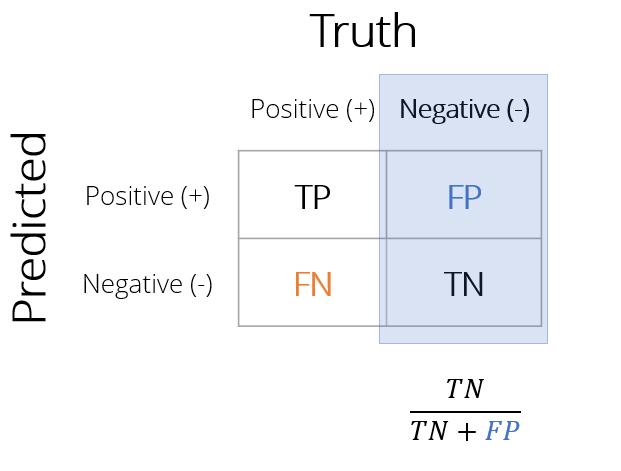
Specificità
La specificità è la quota dei negativi correttamente classificati
- Dei clienti che non hanno acquistato, quale quota il modello ha previsto correttamente?
- Meno falsi positivi ⇒ specificità più alta
1 - Specificità
- Chiamato anche tasso di falsi positivi (FPR)
- Quota di falsi positivi tra i veri negativi
Calcolare la specificità
La funzione spec()
- Stessi argomenti di
sens() - Restituisce la specificità nella colonna
.estimate
spec(leads_results,
truth = purchased,
estimate = .pred_class)
# A tibble: 1 x 3
.metric .estimator .estimate
<chr> <chr> <dbl>
1 spec binary 0.840
Creare un set di metriche
Set di metriche personalizzati
- Funzione
metric_set()- Crea una funzione di metriche personalizzata con metriche
yardstickscelte - Passa i nomi delle metriche
yardstickinmetric_set() - Usa la funzione personalizzata per calcolare le metriche
- Crea una funzione di metriche personalizzata con metriche
custom_metrics <-
metric_set(accuracy, sens, spec)
custom_metrics(leads_results,
truth = purchased,
estimate = .pred_class)
# A tibble: 3 x 3
.metric .estimator .estimate
<chr> <chr> <dbl>
1 accuracy binary 0.759
2 sens binary 0.617
3 spec binary 0.840
Molte metriche
Metriche per classificazione binaria
Ampia varietà di metriche
accuracy(),kap(),sens(),spec(),ppv(),npv(),mcc(),j_index(),bal_accuracy(),detection_prevalence(),precision(),recall(),f_meas()
Passa i risultati di
conf_mat()asummary()per calcolarle tutte
conf_mat(leads_results,

         truth = purchased,

estimate = .pred_class) %>%
summary()
# A tibble: 13 x 3
   .metric              .estimator .estimate
   <chr>                <chr>          <dbl>
 1 accuracy             binary         0.759
 2 kap                  binary         0.466
 3 sens                 binary         0.617
 4 spec                 binary         0.840
 5 ppv                  binary         0.685
 6 npv                  binary         0.795
 7 mcc                  binary         0.468
 8 j_index              binary         0.456
 9 bal_accuracy         binary         0.728
10 detection_prevalence binary         0.325
11 precision            binary         0.685
12 recall               binary         0.617
13 f_meas               binary         0.649
Ayo berlatih!
Modellazione con tidymodels in R

