Visualizzazione dell’analisi di coorte
Customer Segmentation in Python

Karolis Urbonas
Head of Data Science, Amazon
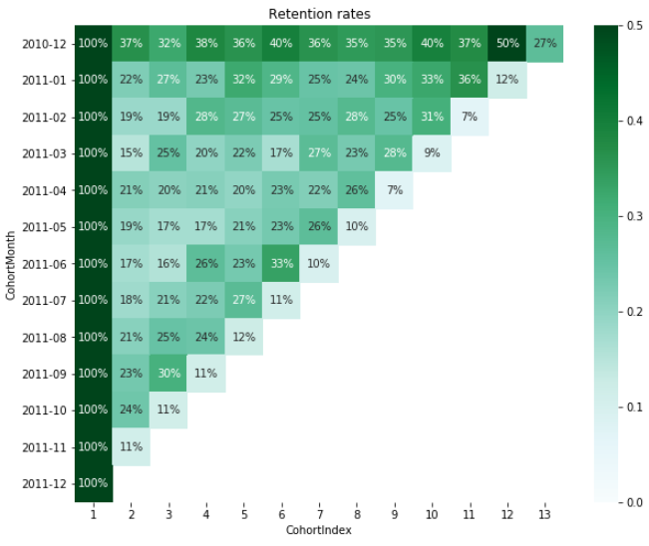
Mappa di calore
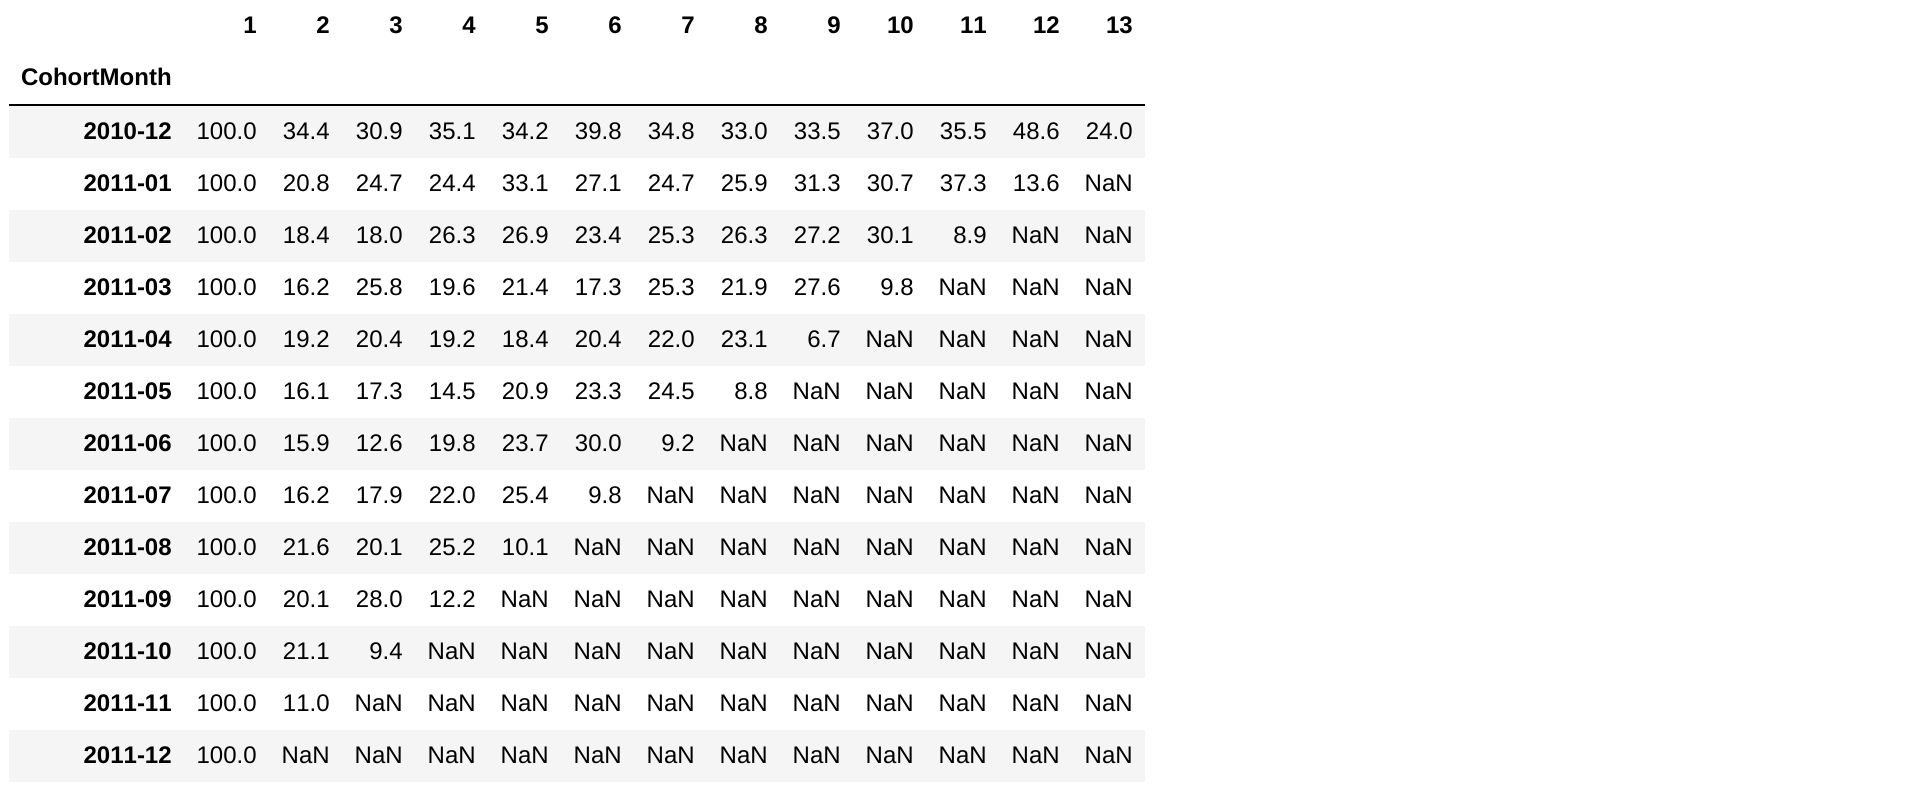
Carica la tabella di retention
retention.round(3)*100
Mappa di calore della retention
Customer Segmentation in Python
Karolis Urbonas
Head of Data Science, Amazon
retention.round(3)*100

