Exploring your data using visualizations
Marketing Analytics: Prevedere il churn dei clienti in Python

Mark Peterson
Director of Data Science, Infoblox
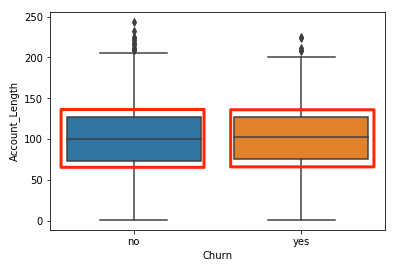
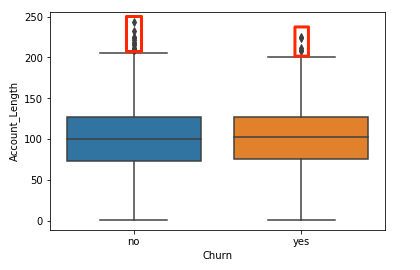
Differences in account length
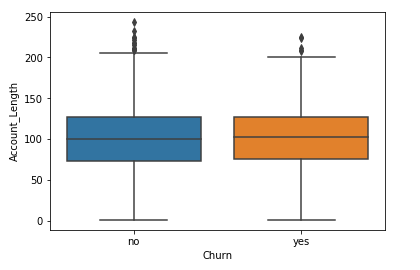
Differences in account lengths
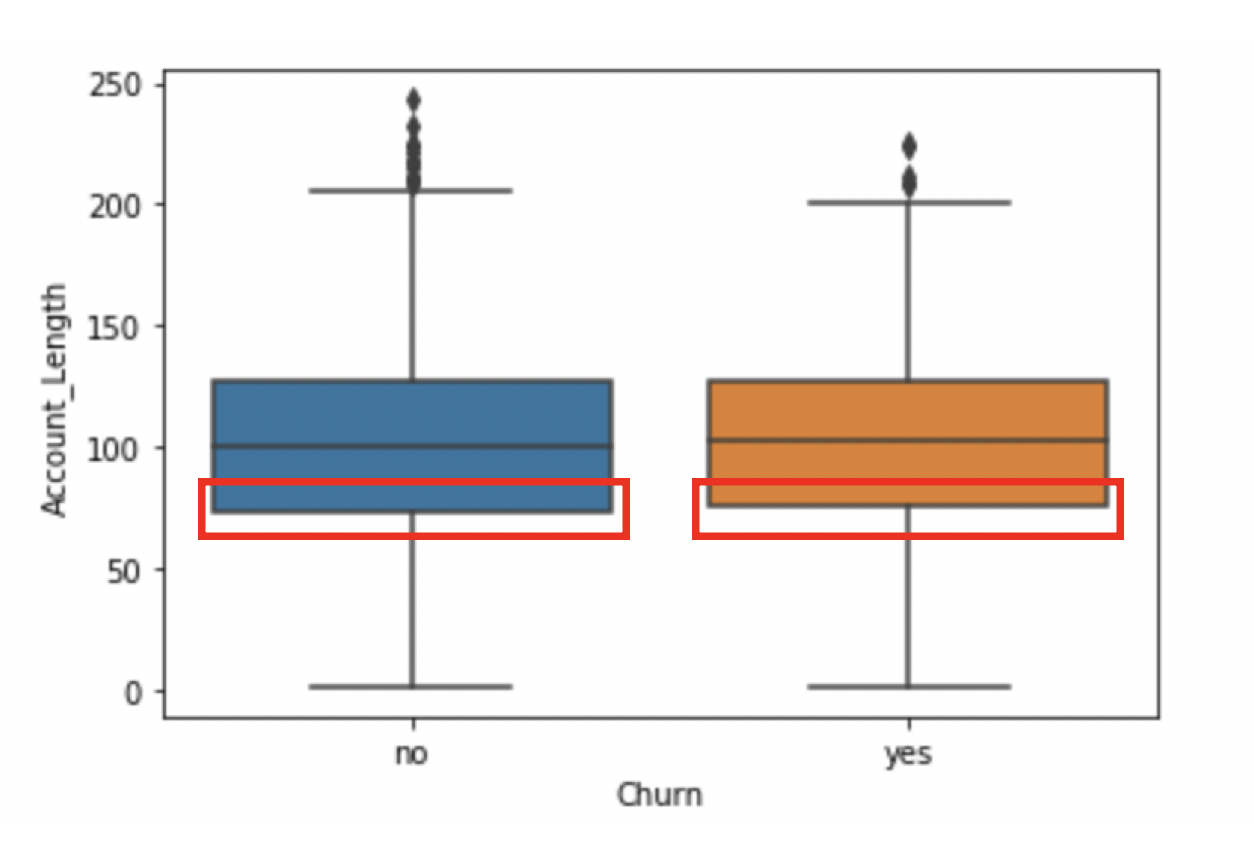
Differences in account lengths
Differences in account lengths
Differences in account lengths
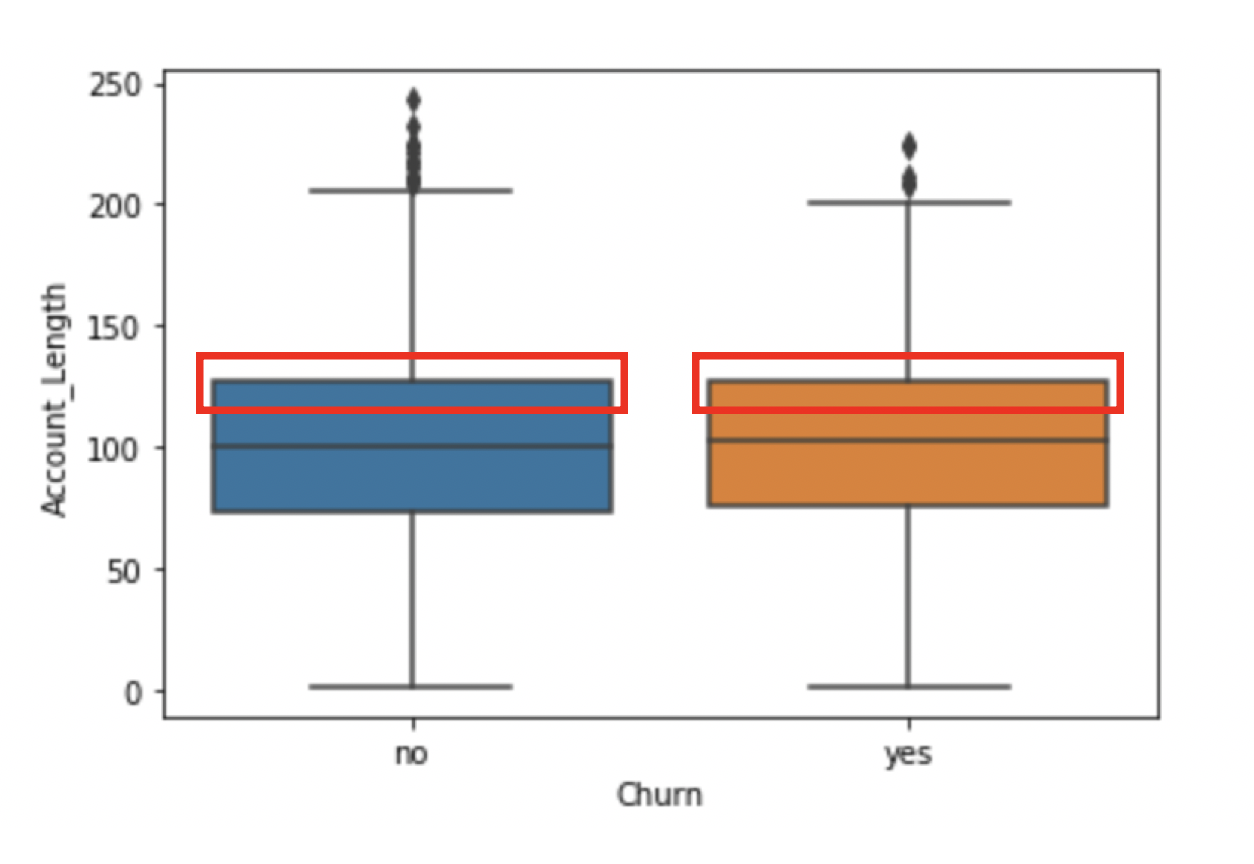
Differences in account lengths
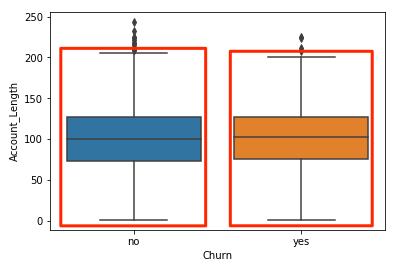
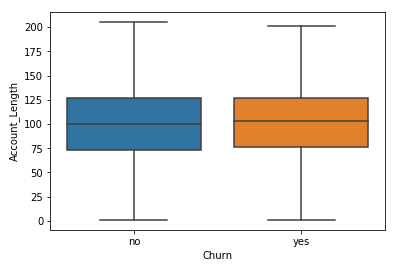
Differences in account length
Differences in account length
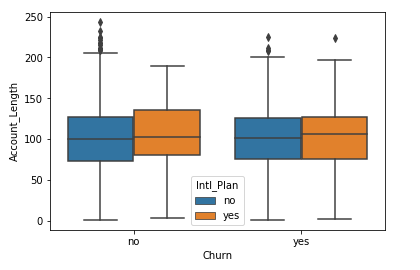
Adding a third variable