Il tuo primo shinydashboard

Creare dashboard con shinydashboard

Png Kee Seng

Researcher

Il percorso fin qui

  • Wireframe nell'interfaccia utente (UI)
    • Header, sidebar, body
  • Definisci output e interazioni con gli input
  • Il server gestisce questo ruolo

disegno

header <- dashboardHeader(...)
sidebar <- dashboardSidebar(...)
body <- dashboardBody(...)

ui <- dashboardPage(header, sidebar, body)
server <- function(input, output) { ... }
shinyApp(ui, server)
Creare dashboard con shinydashboard

Il server

  • Serve definire output e input
  • Specifica gli output e come interagiscono con gli input
  • Utile definire funzioni helper per ridurre il disordine e migliorare la leggibilità
    • Metti queste funzioni all'inizio del codice

Il server è come un cameriere che trasmette le tue istruzioni alla cucina. Nel server di una shinyApp dici a R come gli input devono interagire con gli output.

Creare dashboard con shinydashboard

Aggiungere un grafico

  • Torniamo al dashboard del torneo globale di calcio
  • Aggiungiamo un hexbin plot per il team 1
  • Poi lo inseriamo nel server
  • E se volessimo lo stesso grafico per il team 2?
soccer %>%
  ggplot(aes(x=`1_passes_compeletd`, 
             y=`1_goal_prevented`)) +
  geom_hex(bins=10) + theme_classic()
server <- function(input, output){
  output$plot1 <- renderPlot({
  fifa %>%
    ggplot(aes(x=`1_passes_compeletd`, 
               y=`1_goal_prevented`)) +
    geom_hex(bins=10) + theme_classic()
  })
}
Creare dashboard con shinydashboard

Definire oggetti ggplot nel server

server <- function(input, output) {
  output$plot1 <- renderPlot({
    if (input$team == 1){

fifa %>% ggplot(aes(x=`1_passes_compeletd`, y=`1_goal_prevented`)) + geom_hex(bins=10) + theme_classic()
} else if (input$team == 2){
fifa %>% ggplot(aes(x=`2_passes_compeletd`, y=`2_goal_prevented`)) + geom_hex(bins=10) + theme_classic()
} }) }
Creare dashboard con shinydashboard

Usare funzioni helper

plot_hex <- function(team){
  if (team == 1){
    soccer %>% ggplot(aes(x=`1_passes_compeletd`, 
                        y=`1_goal_prevented`)) +
      geom_hex(bins=10) + theme_classic()
  }
  else if (team == 2){
    soccer %>% ggplot(aes(x=`2_passes_compeletd`, 
                        y=`2_goal_prevented`)) +
      geom_hex(bins=10) + theme_classic()
  }
}
Creare dashboard con shinydashboard

Usare funzioni helper

Con funzione helper

server <- function(input, output) {
  output$plot1 <- renderPlot(plot_hex(input$team)) 
}
  • Non è più leggibile?

Senza funzione helper

server <- function(input, output) {
  output$plot1 <- renderPlot({
    if (input$team == 1){
      soccer %>% ggplot(aes(x=`1_passes_compeletd`, 
              y=`1_goal_prevented`)) +
        geom_hex(bins=10) + theme_classic()
      }
    else if (input$team == 2){
      soccer %>% ggplot(aes(x=`2_passes_compeletd`, 
              y=`2_goal_prevented`)) +
        geom_hex(bins=10) + theme_classic()
      }
    })
}
Creare dashboard con shinydashboard

Mettere tutto insieme

# Un shinydashboard completo

header <- dashboardHeader(title = "Torneo di calcio")
sidebar <- dashboardSidebar(sidebarMenu(menuItem("Passaggi/gol", tabName = "passtab"), menuItem("Vuoto", tabName = "emptytab")))
body <- dashboardBody(tabItems( tabItem("passtab", fluidRow(box(selectInput("team", "Numero squadra", choices = c(1,2))), box(plotOutput("plot1"))) ), tabItem("emptytab")) )
ui <- dashboardPage(header, sidebar, body)
server <- function(input, output) { output$plot1 <- renderPlot(plot_hex(input$team)) }
shinyApp(ui, server)
Creare dashboard con shinydashboard

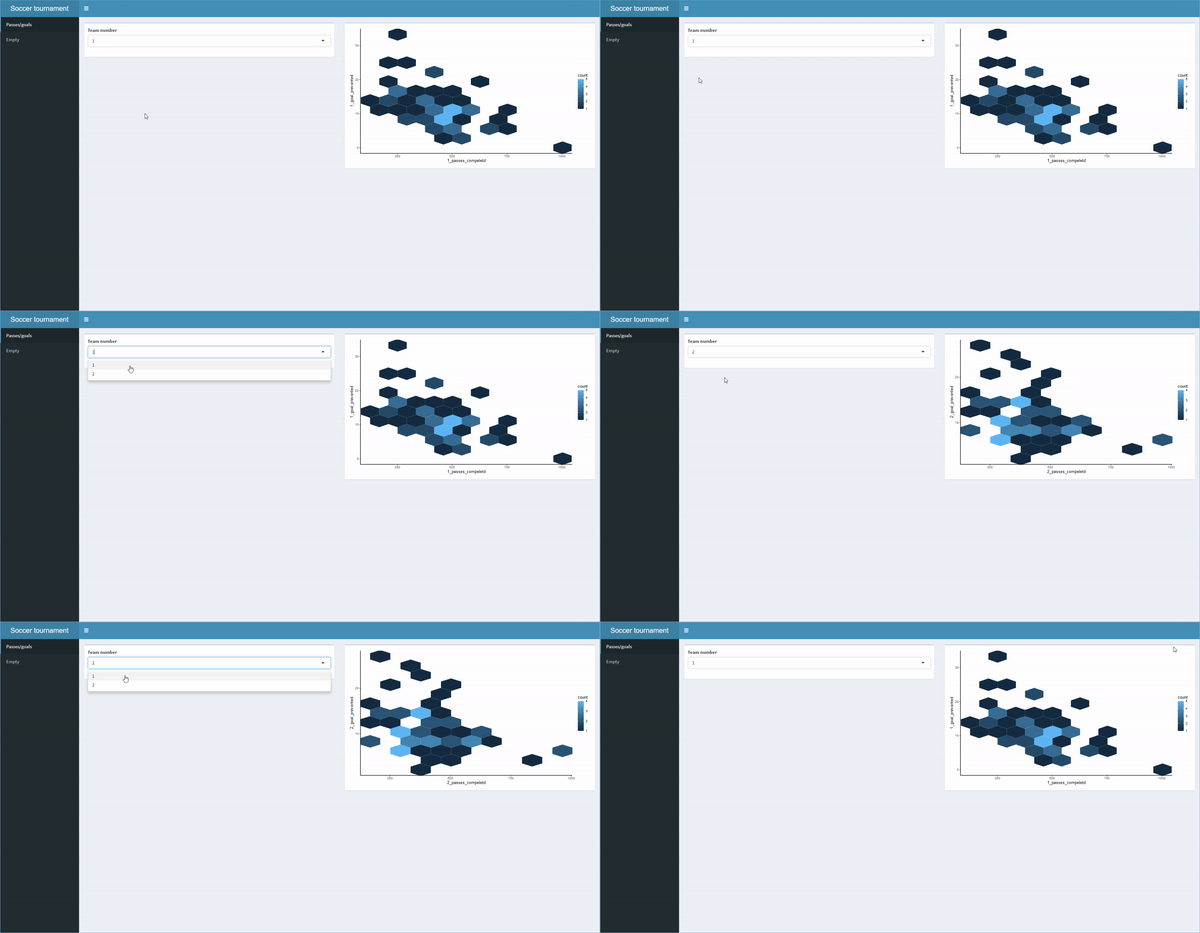
Un'animazione mostra il risultato di shinydashboard. L'utente può passare tra pagine/schede diverse e fornire input per ottenere output diversi.

Creare dashboard con shinydashboard

Passons à la pratique !

Creare dashboard con shinydashboard

Preparing Video For Download...