Come funziona la visualizzazione in Python
Python per chi usa i fogli di calcolo

Chris Cardillo
Data Scientist
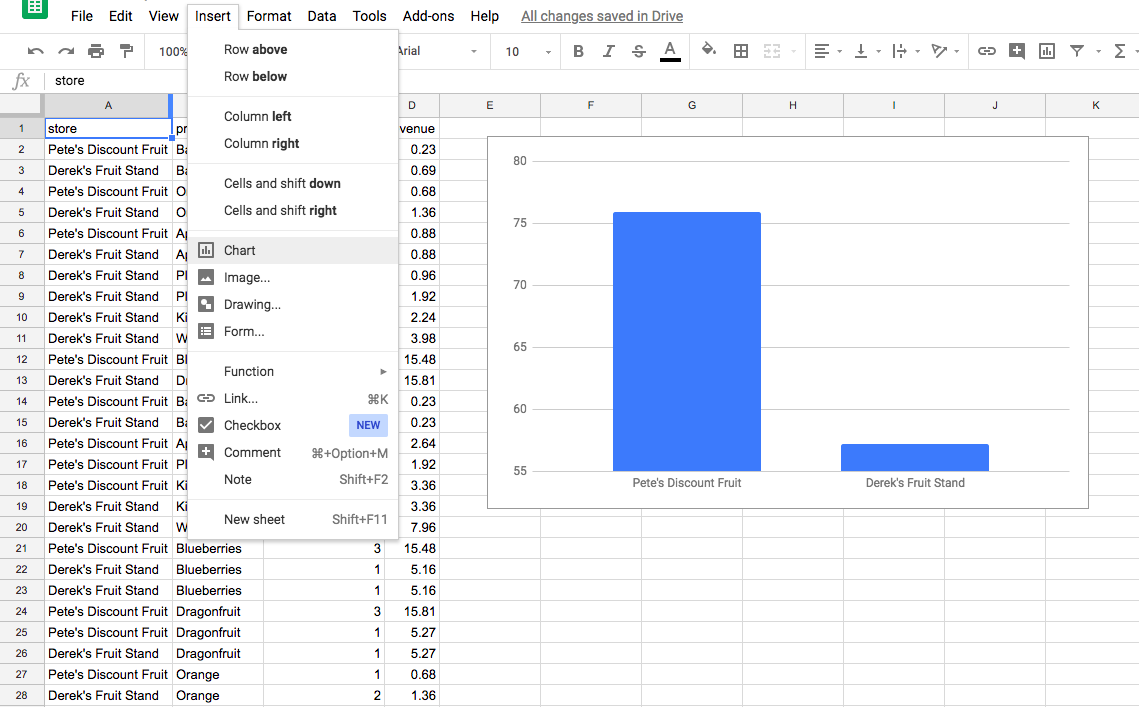
Grafici da foglio di calcolo
Grafici in Python
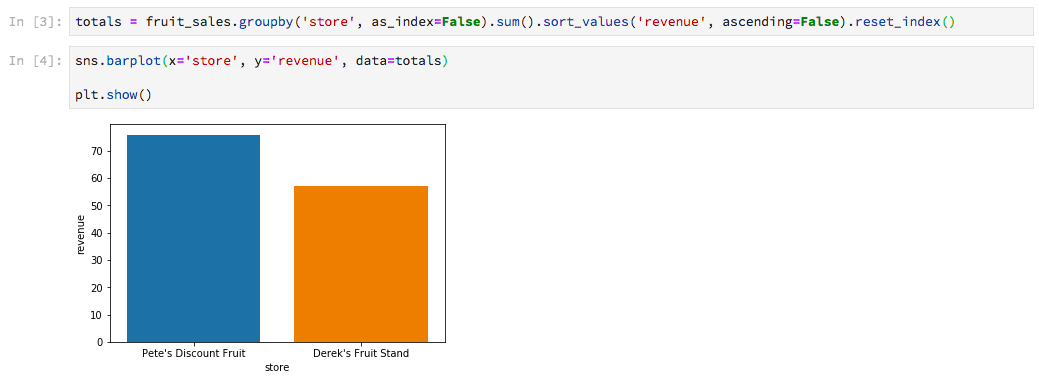
plt.show()
sns.barplot(x='store', y='revenue', data=totals)

plt.show()
Python per chi usa i fogli di calcolo
Chris Cardillo
Data Scientist
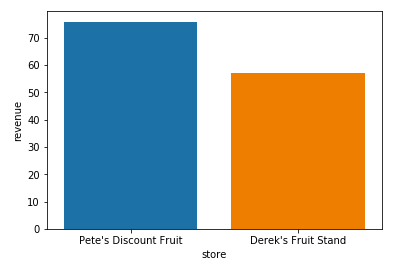
sns.barplot(x='store', y='revenue', data=totals)
plt.show()

