Feature hashing

Feature Engineering in R

Jorge Zazueta

Research Professor and Head of the Modeling Group at the School of Economics, UASLP

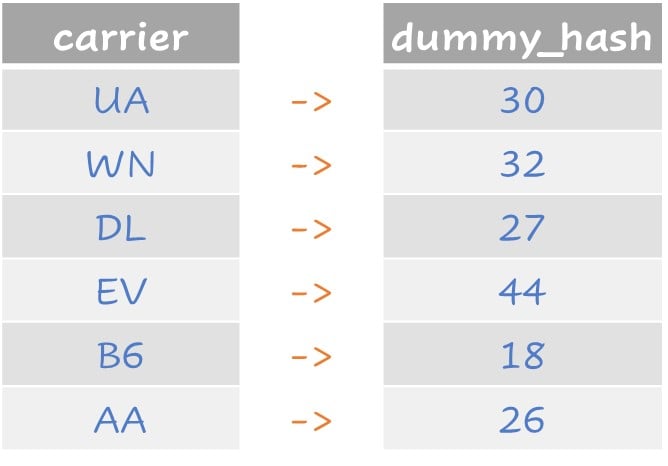
Cos'è il feature hashing?

  • Trasforma una variabile testuale in un insieme di variabili numeriche
  • Usa i valori di hash come indici delle feature
  • Rappresentazione a bassa memoria dei dati
  • Utile quando ci aspettiamo nuove categorie con nuovi dati

Assegna un indice a ogni vettore in base ai valori di testo.

Tabella che illustra il feature hashing per le compagnie aeree.

Feature Engineering in R

Quanti vettori ci sono?

Il dataset flights include i vettori come fattori, ma non sappiamo se compariranno nuovi vettori con nuovi dati.

flights %>%
  select(carrier) %>%
  table()
carrier
  9E   AA   AS   B6   DL   EV   F9   FL   HA   MQ   OO   UA   US   VX   WN   YV 
 859 1744   26 2503 2619 3014   38  186   14 1540    2 3367 1228  244  757   41
Feature Engineering in R

Facciamo l'hash di quella feature

Possiamo creare hash dummy per rappresentare i valori del fattore, usando il package textrecipes.

recipe <- recipe(~carrier, 
                 data = flights_train) %>%
  step_dummy_hash(carrier, prefix = NULL, 
                  signed = FALSE, 
                  num_terms = 50L)
# Prep the recipe
object <- recipe %>%
  prep()

# Bake the recipe object con nuovi dati
baked <- bake(object,
              new_data = flights_test)

Uno sguardo alla rappresentazione di step_dummy_hash().

bind_cols(flights_test$carrier,baked)[1:6,c(1,18:20)]
New names:
• `` -> `...1`
# A tibble: 10 × 4
   ...1  `_carrier_17` `_carrier_18` `_carrier_19`
   <chr>         <int>         <int>         <int>
 1 EV                0             0             0
 2 B6                0             1             0
 3 EV                0             0             0
 4 MQ                0             0             0
 5 DL                0             0             0
 6 EV                0             0             0
Feature Engineering in R

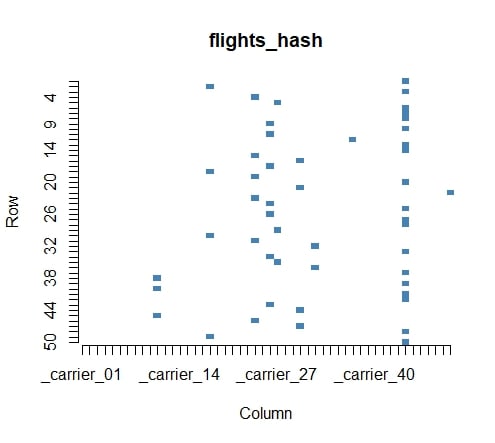
Visualizzare l'hashing

Possiamo ispezionare la matrice con il package plot.matrix.

flights_hash <- 
    as.matrix(baked)[1:50,] 

plot(flights_hash, 
     col = c("white","steelblue"), 
     key = NULL,
     border = NA)

Rappresentazione grafica di un campione degli hash dummy assegnati al fattore del vettore originale.

Feature Engineering in R

Passons à la pratique !

Feature Engineering in R

Preparing Video For Download...