Inferenza per dati numerici in R
Mine Cetinkaya-Rundel
Associate Professor of the Practice, Duke University
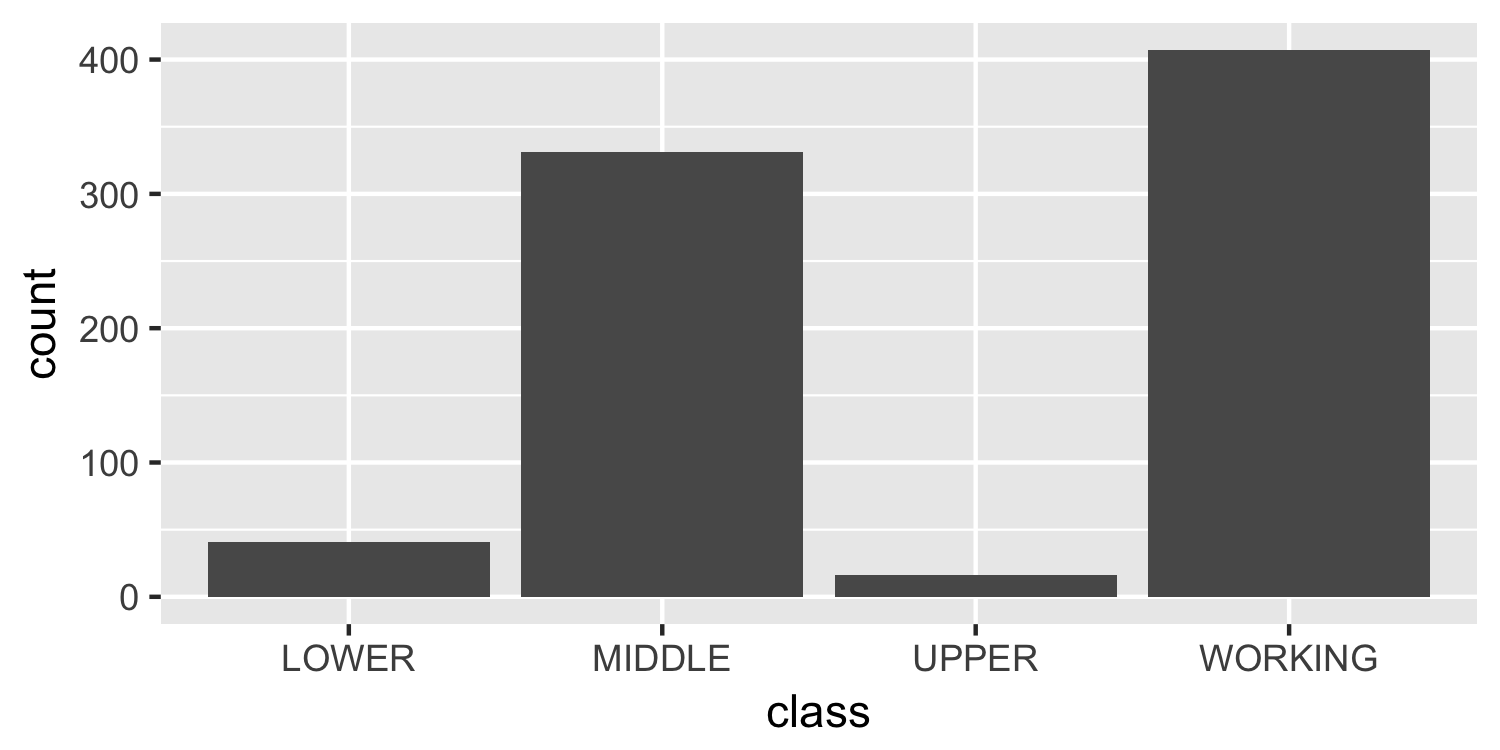
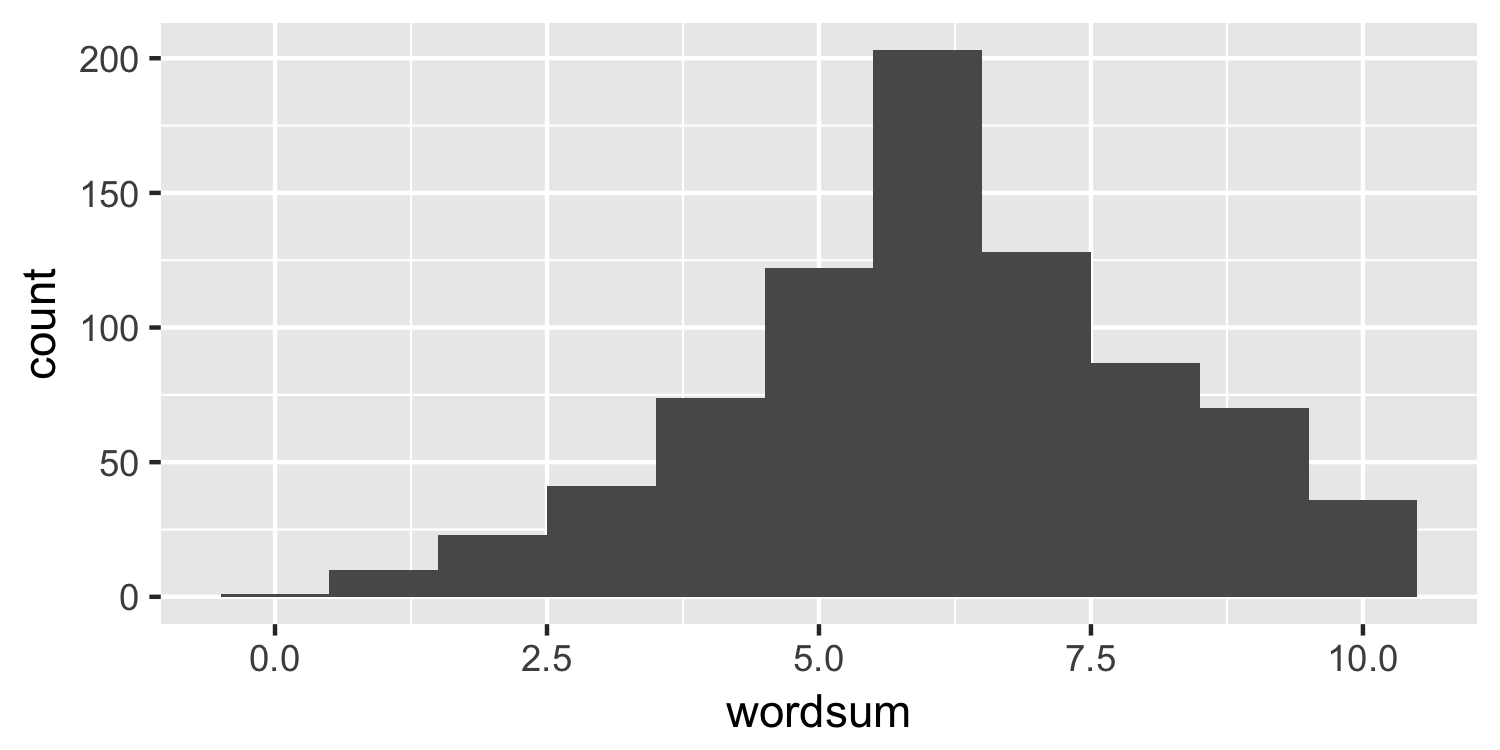
wordsum: test di vocabolario con 10 domande (punteggio da 0 a 10)class: classe sociale autoidentificata (lower, working, middle, upper) wordsum class
1 6 MIDDLE
2 9 WORKING
3 6 WORKING
4 5 WORKING
5 6 WORKING
6 6 WORKING
... ... ...
795 9 MIDDLE
ggplot(data = gss, aes(x = wordsum)) +
geom_histogram(binwidth = 1)
Se dovessi scegliere uno di quattro nomi per la tua classe sociale, in quale ti collocheresti: lower, working, middle o upper class?
ggplot(data = gss, aes(x = wordsum)) +
geom_histogram(binwidth = 1)

Inferenza per dati numerici in R