Tracciare la regressione

A/B Testing in R

Lauryn Burleigh

Data Scientist

Retta lineare

cor.test(~ Enjoy + Time, data = pizza, 
         method = "pearson")
library(ggplot2)
ggplot(pizza, aes(x = Enjoy, 
                  y = Time)) + 
  geom_point()
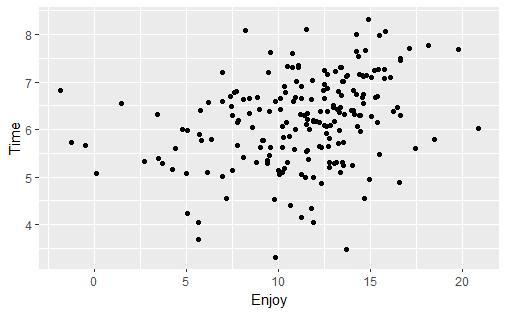
Scatter plot con correlazione positiva: tempo per mangiare la pizza sull'asse y ed enjoy sull'asse x.

ggplot(pizza, aes(x = Enjoy, 
                  y = Time)) + 
  geom_point() +
  geom_smooth(method = "lm")
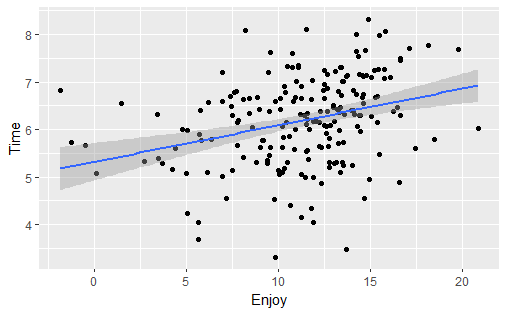
Scatter plot con correlazione positiva: tempo per mangiare la pizza sull'asse y ed enjoy sull'asse x, con linea blu di best fit e intervallo di confidenza.

A/B Testing in R

Previsione lineare

linear <- lm(Time ~ Enjoy, 
                data = Pizza) 
Enjoy  <- 12
topredict <-  data.frame(Enjoy) 
prediction <- predict(linear, 
                     newdata = topredict) 

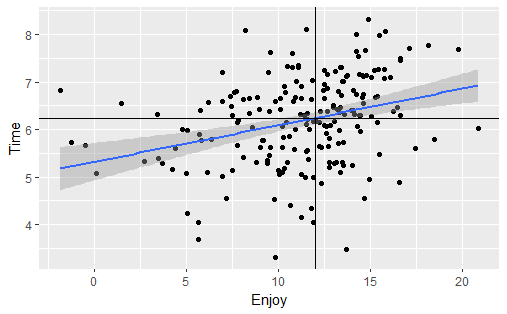
ggplot(pizza, aes(x = Enjoy, y = Time)) + 
  geom_point() +
  geom_smooth(method = "lm") +  
  geom_hline(yintercept = prediction) + 
  geom_vline(xintercept = Enjoy) 

Scatter plot con correlazione positiva: tempo per mangiare la pizza sull'asse y ed enjoy sull'asse x, con linea blu di best fit e intervallo di confidenza e linee nere che si intersecano a x=12 e y=6,24.

A/B Testing in R

Indicazione dei gruppi

ggplot(pizza, aes(x = Enjoy, y = Time, 
                  color = Topping)) + 
  geom_point() +
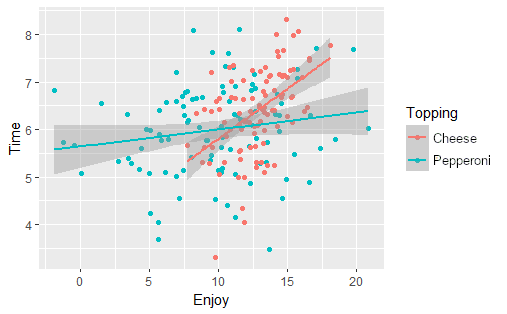
  geom_smooth(method = "lm") 

Scatter plot con correlazione positiva: tempo per mangiare la pizza sull'asse y ed enjoy sull'asse x; punti e linea di best fit per Pepperoni in rosa e per Cheese in blu.

A/B Testing in R

Indicazione dei gruppi

ggplot(pizza, aes(x = Enjoy, 
                  y = Time)) + 
  geom_point(aes(colour = Topping)) +
  geom_smooth(method = "lm")

Scatter plot con correlazione positiva: tempo per mangiare la pizza sull'asse y ed enjoy sull'asse x, con linea blu di best fit; punti Cheese in blu e Pepperoni in rosa.

A/B Testing in R

Curva logistica

ggplot(pizza, aes(x = Enjoy, 
                  y = EatAgain)) + 
  geom_point(aes(colour = Topping)) +
  geom_smooth(method = "glm",  
              method.args = 
                 list(family = 
                      "binomial"))

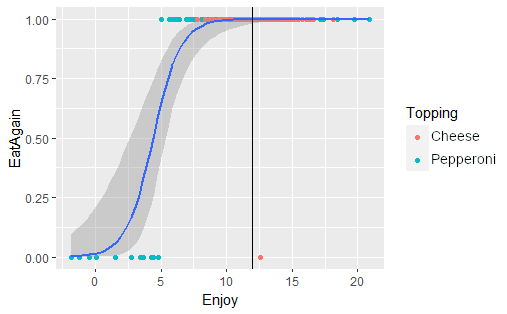
Scatter plot con enjoy sull'asse x ed eat again sull'asse y, punti a 0 o 1 e curva di regressione logistica.

A/B Testing in R

Previsione logistica

Enjoy  <- 12

ggplot(pizza2, aes(x = Enjoy, 
                   y = EatAgain)) + 
  geom_point(aes(colour = Topping)) +
  geom_smooth(method = "glm",  
              method.args = 
              list(family = 
                   "binomial")) +
  geom_vline(xintercept = Enjoy) 

Scatter plot con enjoy sull'asse x ed eat again sull'asse y, punti a 0 o 1 (Pepperoni in rosa, Cheese in blu), curva logistica e linea verticale nera a x=12.

A/B Testing in R

Mettiamoci alla prova!

A/B Testing in R

Preparing Video For Download...