Funzionalità avanzate per migliorare il grafico
Casi di studio: creare applicazioni web con Shiny in R

Dean Attali
Shiny Consultant
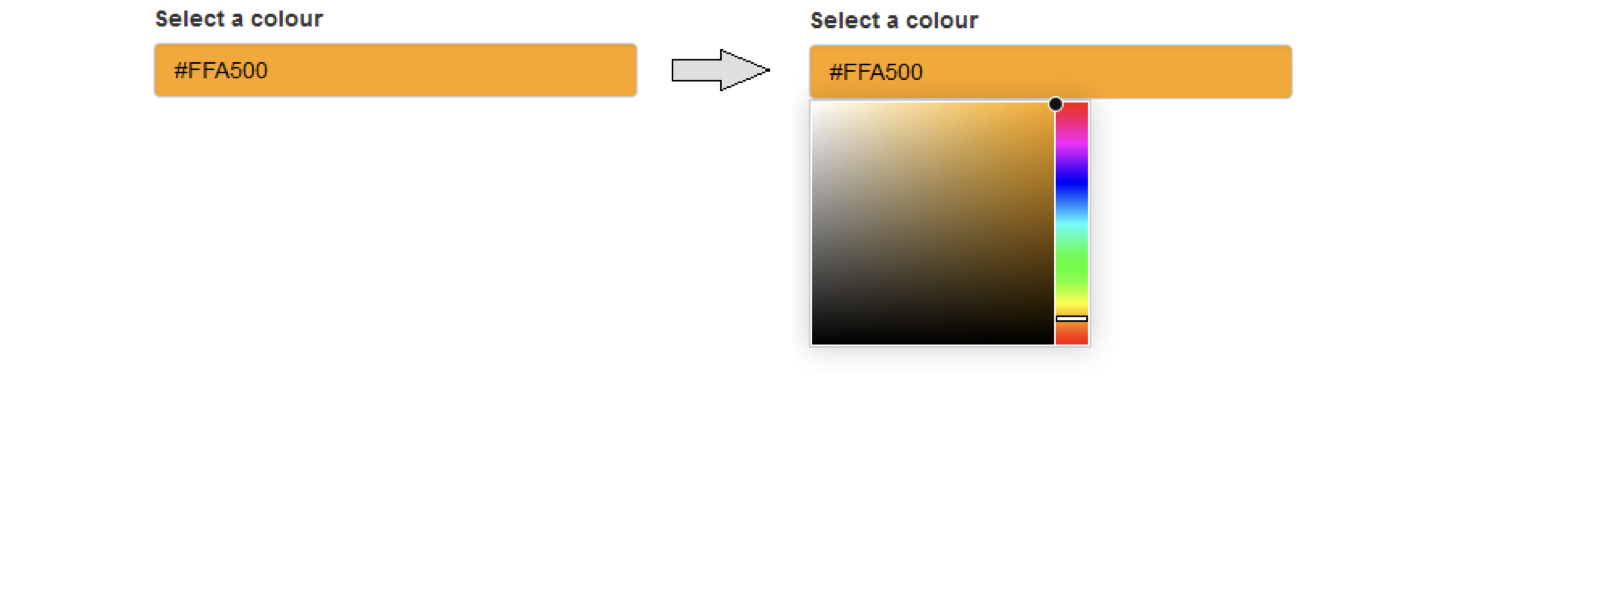
Input colore
library(colourpicker)colourInput("col", "Select a colour", value = "orange")
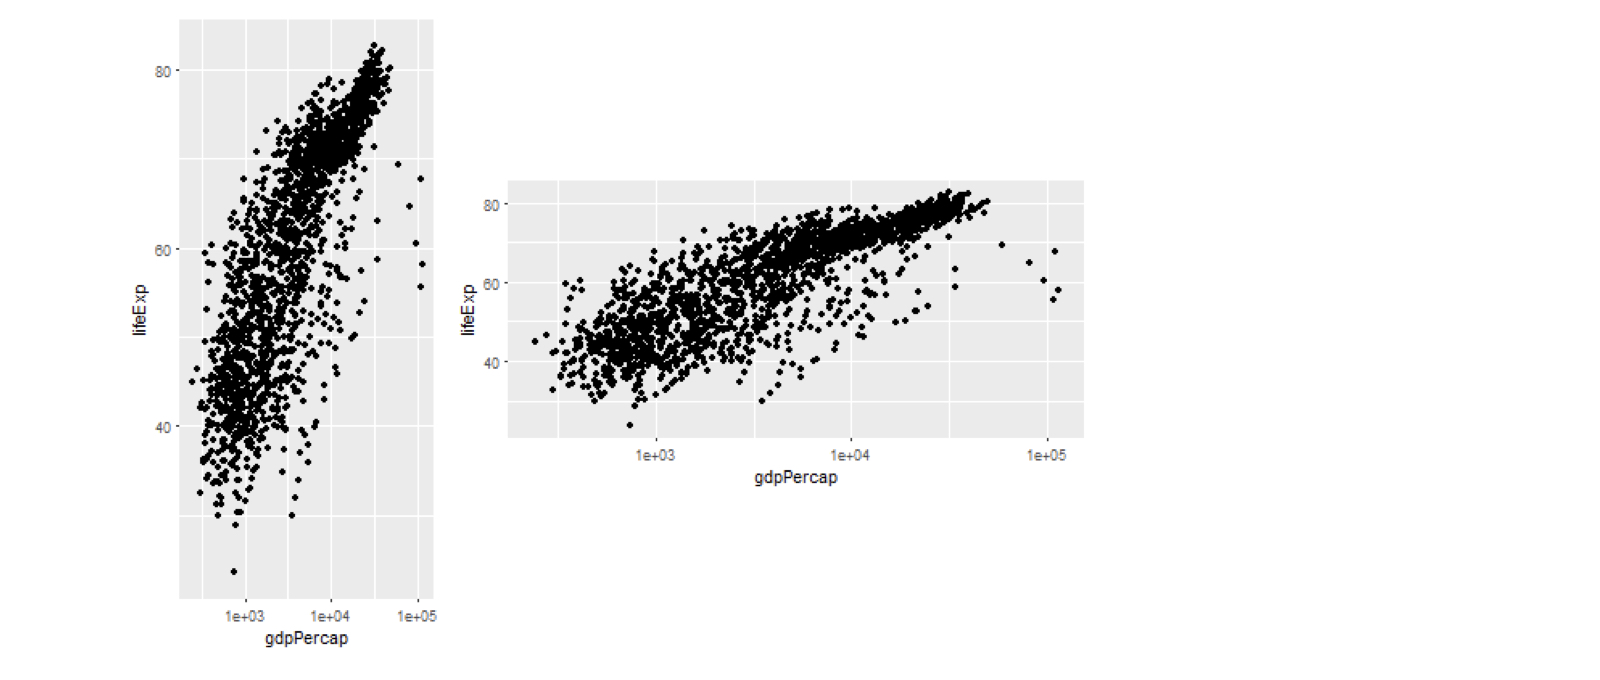
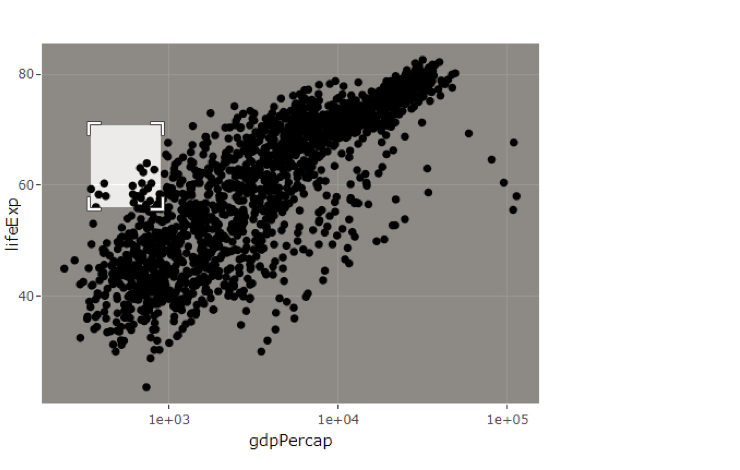
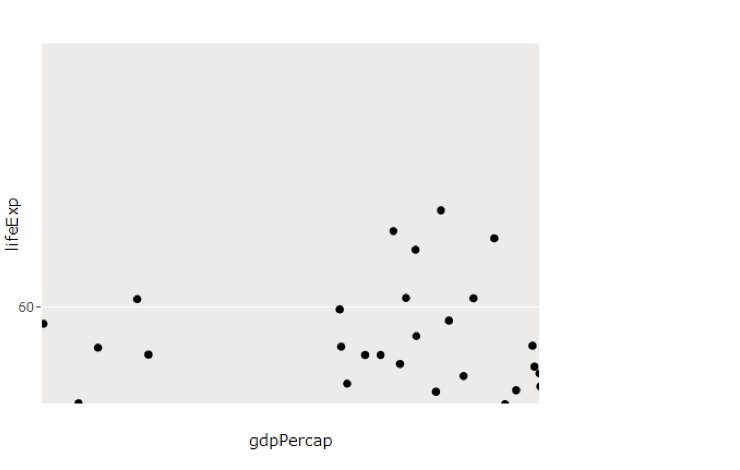
Argomenti di plotOutput
plotOutput("plot1", width = 200, height = 400)
plotOutput("plot2", width = 400, height = 200)
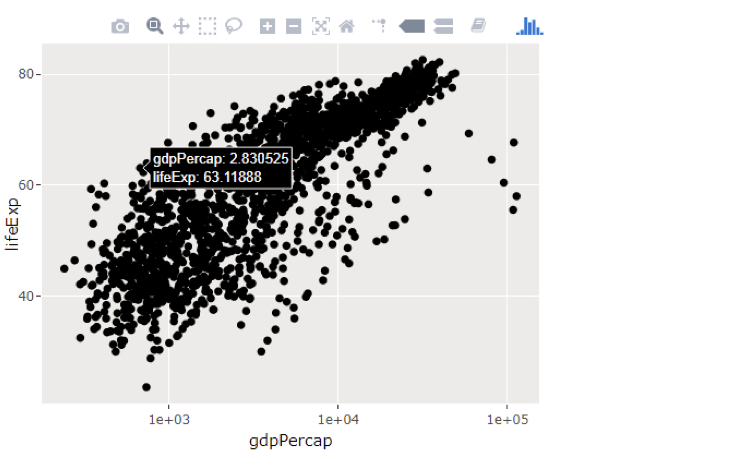
Grafici interattivi con plotly
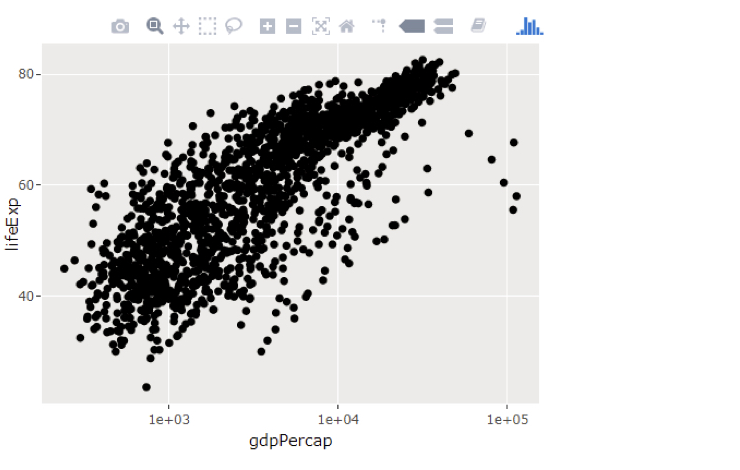
Grafici interattivi con plotly
Grafici interattivi con plotly
Grafici interattivi con plotly