Generare un insieme di dati radialmente separabile

Support Vector Machines in R

Kailash Awati

Instructor

Generare un set di punti 2D uniformemente distribuito

  • Genera un dataset con 200 punti
    • 2 predittori x1 e x2, distribuiti uniformemente tra -1 e 1.
# Set required number of datapoints
n <- 200
# Set seed to ensure reproducibility
set.seed(42)

# Generate dataframe with 2 predictors x1 and x2 in (-1, 1)
df <- data.frame(x1 = runif(n, min = -1, max = 1),
                 x2 = runif(n, min = -1, max = 1))
Support Vector Machines in R

Crea un confine circolare

  • Crea un confine decisionale circolare di raggio 0,7 unità.
  • La variabile categorica y vale +1 o -1 se il punto è fuori o dentro il confine.
radius <- 0.7
radius_squared <- radius ^ 2

#categorize data points depending on location wrt boundary
df$y <- factor(ifelse(df$x1 ^ 2 + df$x2 ^ 2 < radius_squared, -1, 1),
               levels = c(-1, 1))
Support Vector Machines in R

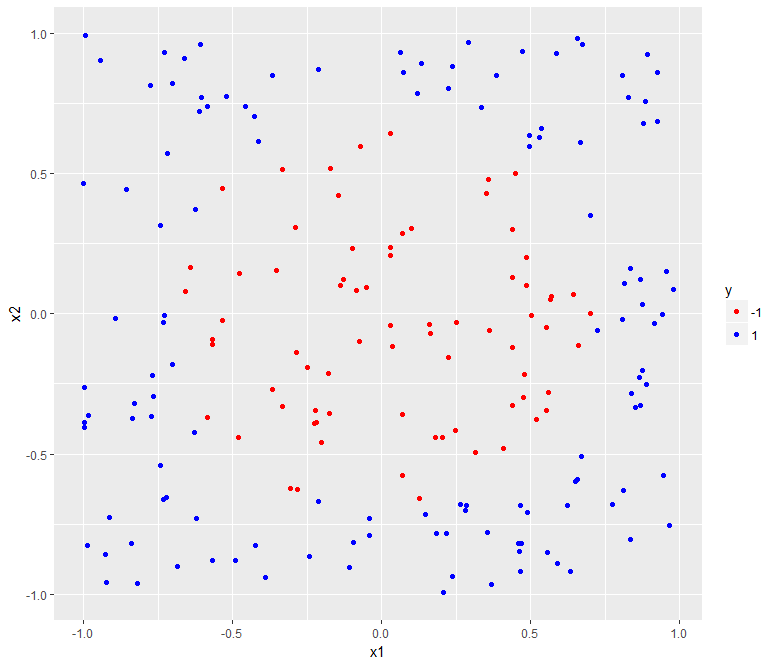
Traccia il dataset

  • Visualizza con ggplot.
library(ggplot2)
  • predittori sui 2 assi; classi distinte per colore.
# Build plot
p <- ggplot(data = df, aes(x = x1, y = x2, color = y)) + 
     geom_point() + 
     scale_color_manual(values = c("-1" = "red", "1" = "blue")) 
# Display plot 
p
Support Vector Machines in R

Capitolo 3.1 - dataset radialmente separabile

Support Vector Machines in R

Aggiungere un confine circolare - Parte 1

  • Creiamo una funzione per generare un cerchio
# Function generates dataframe with points
# lying on a circle of radius r
circle <- 
  function(x1_center, x2_center, r, npoint = 100) {

  # Angular spacing of 2*pi/npoint between points
  theta <- seq(0, 2 * pi, length.out = npoint)
  x1_circ <- x1_center + r * cos(theta)
  x2_circ <- x2_center + r * sin(theta)

  data.frame(x1c = x1_circ, x2c = x2_circ)
}
Support Vector Machines in R

Aggiungere un confine circolare - Parte 2

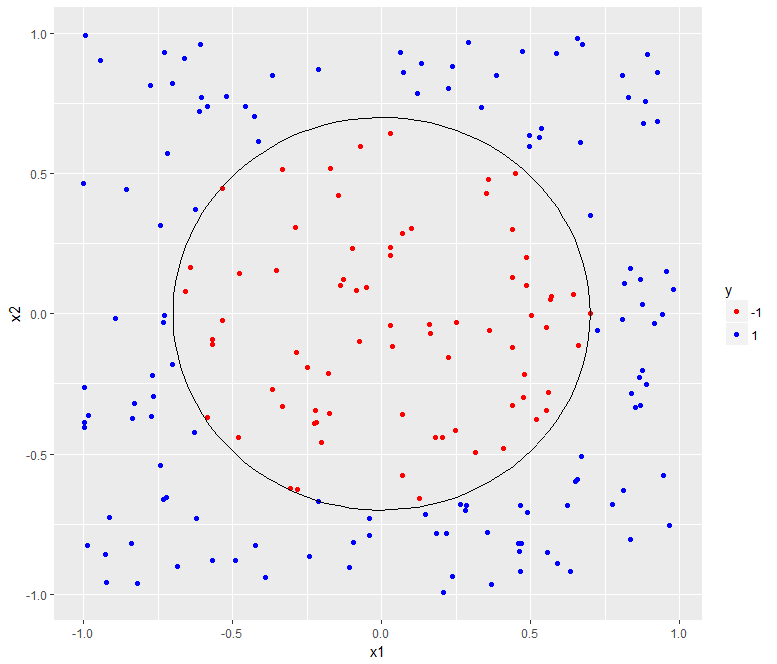
  • Per aggiungere il confine al grafico:
    • genera il confine con la funzione circle().
    • aggiungi il confine al grafico con geom_path()
# Generate boundary
boundary <- circle(x1_center = 0,
                   x2_center = 0,
                   r = radius)
# Add boundary to previous plot
p <- p + 
     geom_path(data = boundary,
               aes(x = x1c, y = x2c),
               inherit.aes = FALSE)
# Display plot
p
Support Vector Machines in R

Capitolo 3.1 - dataset radialmente separabile con confine decisionale

Support Vector Machines in R

Esercitiamoci!

Support Vector Machines in R

Preparing Video For Download...