Analisi dell'espressione differenziale con limma in R
John Blischak
Instructor
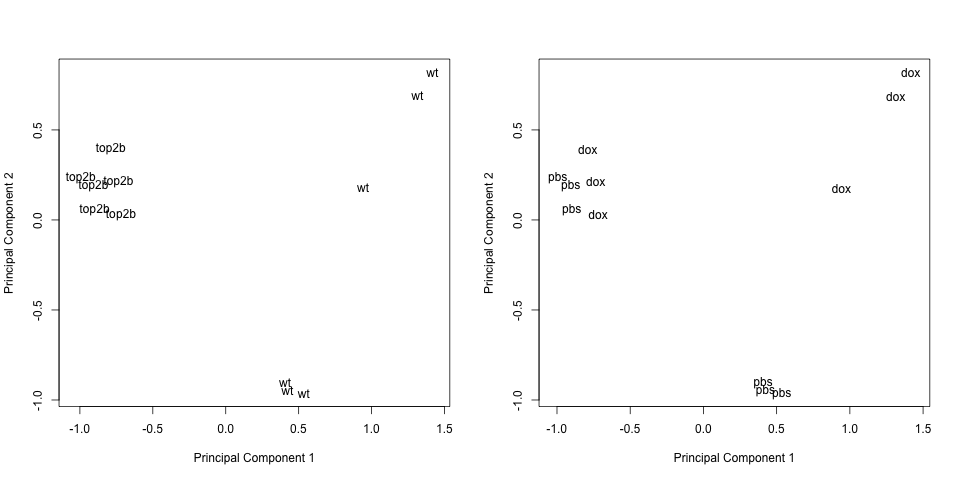
# Plot delle componenti principali etichettate per genotipo
plotMDS(eset, labels = pData(eset)[, "genotype"], gene.selection = "common")
# Plot delle componenti principali etichettate per trattamento
plotMDS(eset, labels = pData(eset)[, "treatment"], gene.selection = "common")
Crea la matrice di disegno con model.matrix
Costruisci la matrice dei contrasti con makeContrasts
Testa i contrasti con lmFit, contrasts.fit ed eBayes
$$ Y = \beta_1 X_1 + \beta_2 X_2 + \beta_3 X_3 + \beta_4 X_4 + \epsilon $$
top2b trattati con doxtop2b trattati con pbswt trattati con doxwt trattati con pbs| $\beta_1$ | $\beta_2$ | $\beta_3$ | $\beta_4$ | |
|---|---|---|---|---|
genotype |
top2b | top2b | wt | wt |
treatment |
dox | pbs | dox | pbs |
Response of wild type mice to dox treatment: $\beta_3 - \beta_4 = 0$
Response of Top2b null mice to dox treatment: $\beta_1 - \beta_2 = 0$
Differences between Top2b null and wild type mice in response to dox treatment: $(\beta_1 - \beta_2) - (\beta_3 - \beta_4) = 0$
Stima i coefficienti del modello con lmFit
Applica i contrasti con contrasts.fit
Calcola le t-statistiche con eBayes
# Riassumi i risultati
results <- decideTests(fit2)
summary(results)
# Crea un diagramma di Venn
vennDiagram(results)
Analisi dell'espressione differenziale con limma in R