Geometrie simple feature e tidycensus

Analizzare i dati del Censimento USA in R

Kyle Walker

Instructor

L'argomento geometry = TRUE

  • geometry = TRUE è disponibile per le seguenti geografie:
    • "state"
    • "county"
    • "tract"
    • "block group"
    • "block"
    • "zcta" (anche "zip code tabulation area")
Analizzare i dati del Censimento USA in R

Ottenere geometrie simple feature

library(tidycensus)
library(tidyverse)
library(sf)

cook_value <- get_acs(geography = "tract", state = "IL", 
                      county = "Cook", 
                      variables = "B25077_001", 
                      geometry = TRUE)
Analizzare i dati del Censimento USA in R

Geometrie simple feature

head(cook_value, 3)
Simple feature collection with 3 features and 5 fields
geometry type:  MULTIPOLYGON
dimension:      XY
bbox:           xmin: -87.68465 ymin: 42.01232 xmax: -87.66434 ymax: 42.02297
epsg (SRID):    4269
proj4string:    +proj=longlat +datum=NAD83 +no_defs
        GEOID                                       NAME   variable
1 17031010100    Census Tract 101, Cook County, Illinois B25077_001
2 17031010201 Census Tract 102.01, Cook County, Illinois B25077_001
3 17031010202 Census Tract 102.02, Cook County, Illinois B25077_001
  estimate   moe                       geometry
1   230700 62332 MULTIPOLYGON (((-87.6772 42...
2   151100 19099 MULTIPOLYGON (((-87.68465 4...
3   133300 84063 MULTIPOLYGON (((-87.67685 4...
Analizzare i dati del Censimento USA in R

Rappresentare le geometrie di tidycensus

plot(cook_value["estimate"])
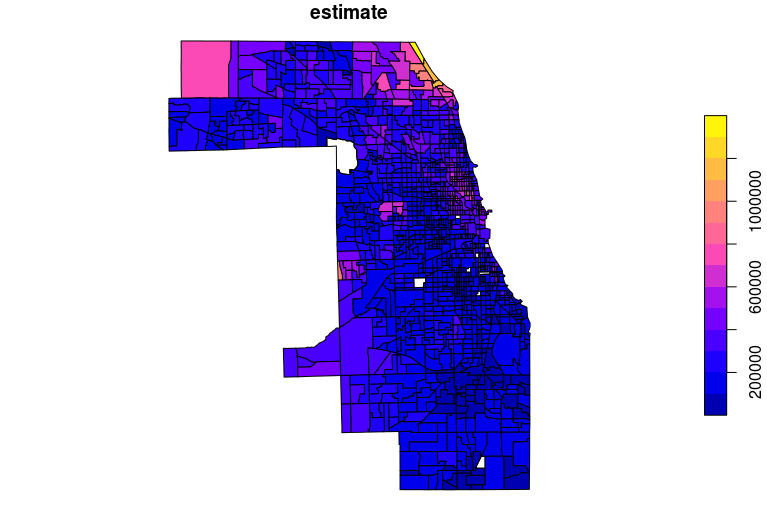
grafico base della Contea di Cook

Analizzare i dati del Censimento USA in R

Unire dati tigris e tidycensus

library(tigris)

idaho_income <- get_acs(geography = "school district (unified)", 
                        variables = "B19013_001", 
                        state = "ID")

idaho_school <- school_districts(state = "ID", 
                                 type = "unified", 
                                 class = "sf")

id_school_joined <- left_join(idaho_school, 
                              idaho_income, 
                              by = "GEOID")
Analizzare i dati del Censimento USA in R

Unire dati tigris e tidycensus

plot(id_school_joined["estimate"])
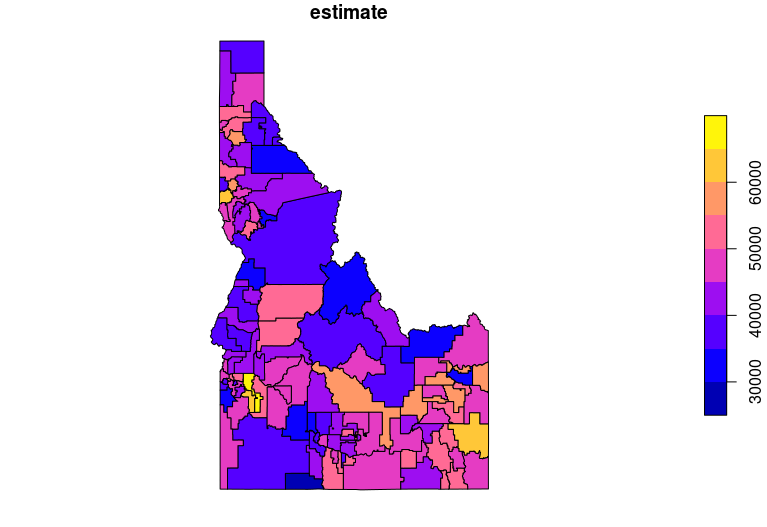
Reddito per distretto scolastico in Idaho

Analizzare i dati del Censimento USA in R

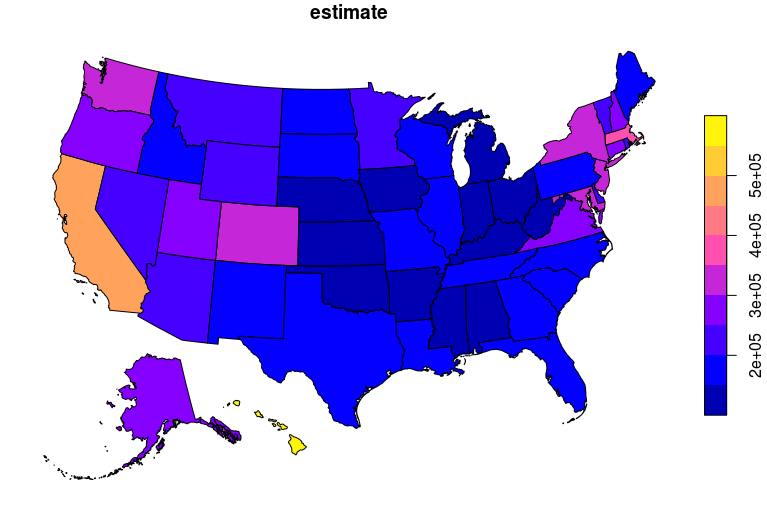
Spostare le geometrie di Alaska e Hawaii

state_value <- get_acs(geography = "state", 
                       variables = "B25077_001", 
                       survey = "acs1", 
                       geometry = TRUE, 
                       shift_geo = TRUE)

plot(state_value["estimate"])
Analizzare i dati del Censimento USA in R

Grafico di shift_geo

Analizzare i dati del Censimento USA in R

Esercitiamoci!

Analizzare i dati del Censimento USA in R

Preparing Video For Download...