Analizzare i dati del Censimento USA in R
Kyle Walker
Instructor
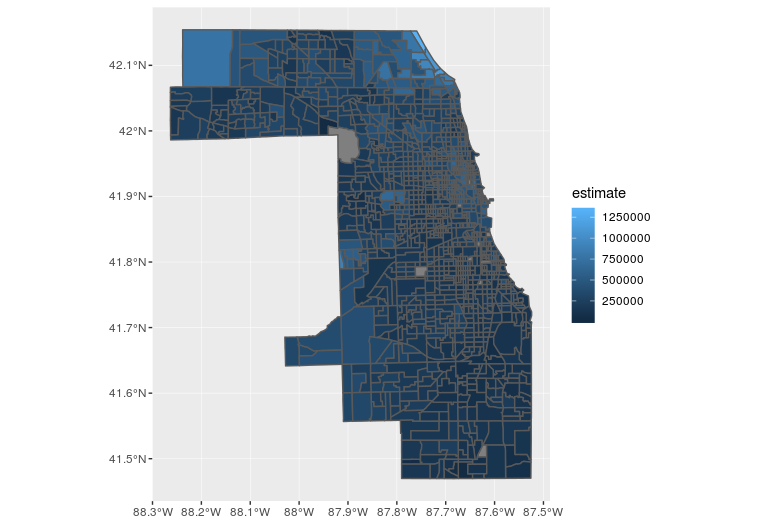
library(ggplot2)
ggplot(cook_value, aes(fill = estimate)) +
geom_sf()

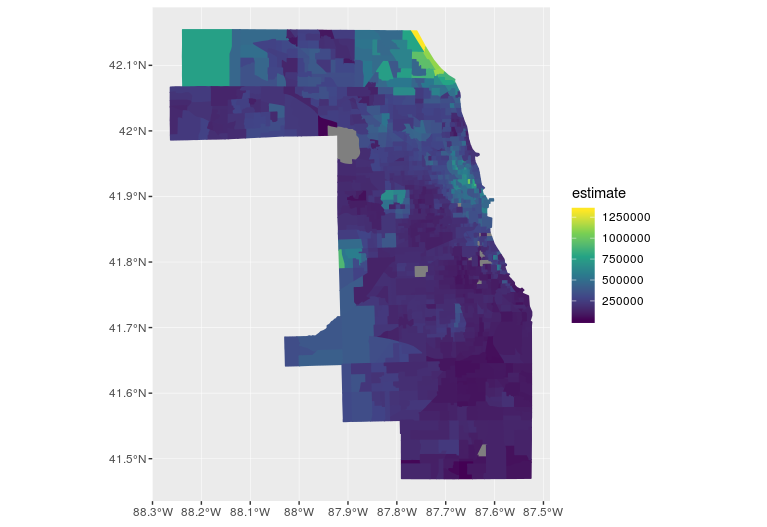
ggplot(cook_value, aes(fill = estimate, color = estimate)) +
geom_sf() +
scale_fill_viridis_c() +
scale_color_viridis_c()
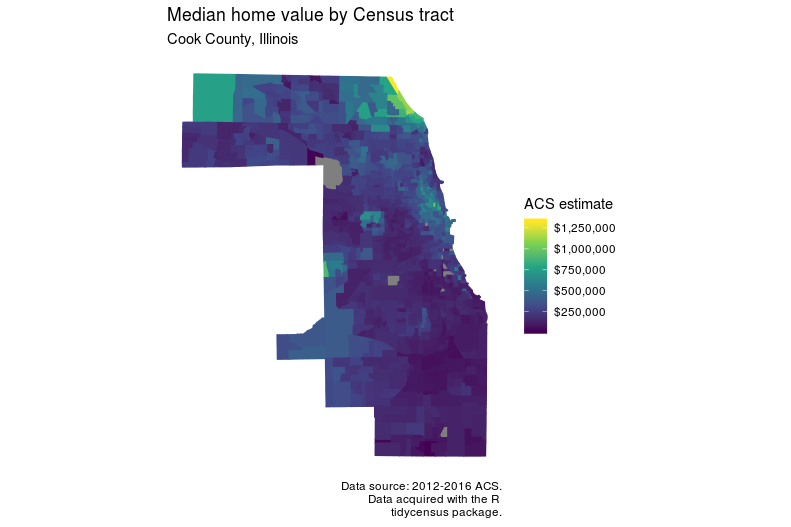
ggplot(cook_value, aes(fill = estimate, color = estimate)) +
geom_sf() +
scale_fill_viridis_c(labels = scales::dollar) +
scale_color_viridis_c(guide = FALSE) +
theme_minimal() +
coord_sf(crs = 26916, datum = NA) +
labs(title = "Valore mediano delle case per Census tract",
subtitle = "Contea di Cook, Illinois",
caption = "Fonte dati: ACS 2012-2016.\nDati ottenuti con il pacchetto
tidycensus di R.",
fill = "Stima ACS")

Analizzare i dati del Censimento USA in R