La scorciatoia dell’approssimazione
Inferenza per dati categorici in R

Andrew Bray
Assistant Professor of Statistics at Reed College
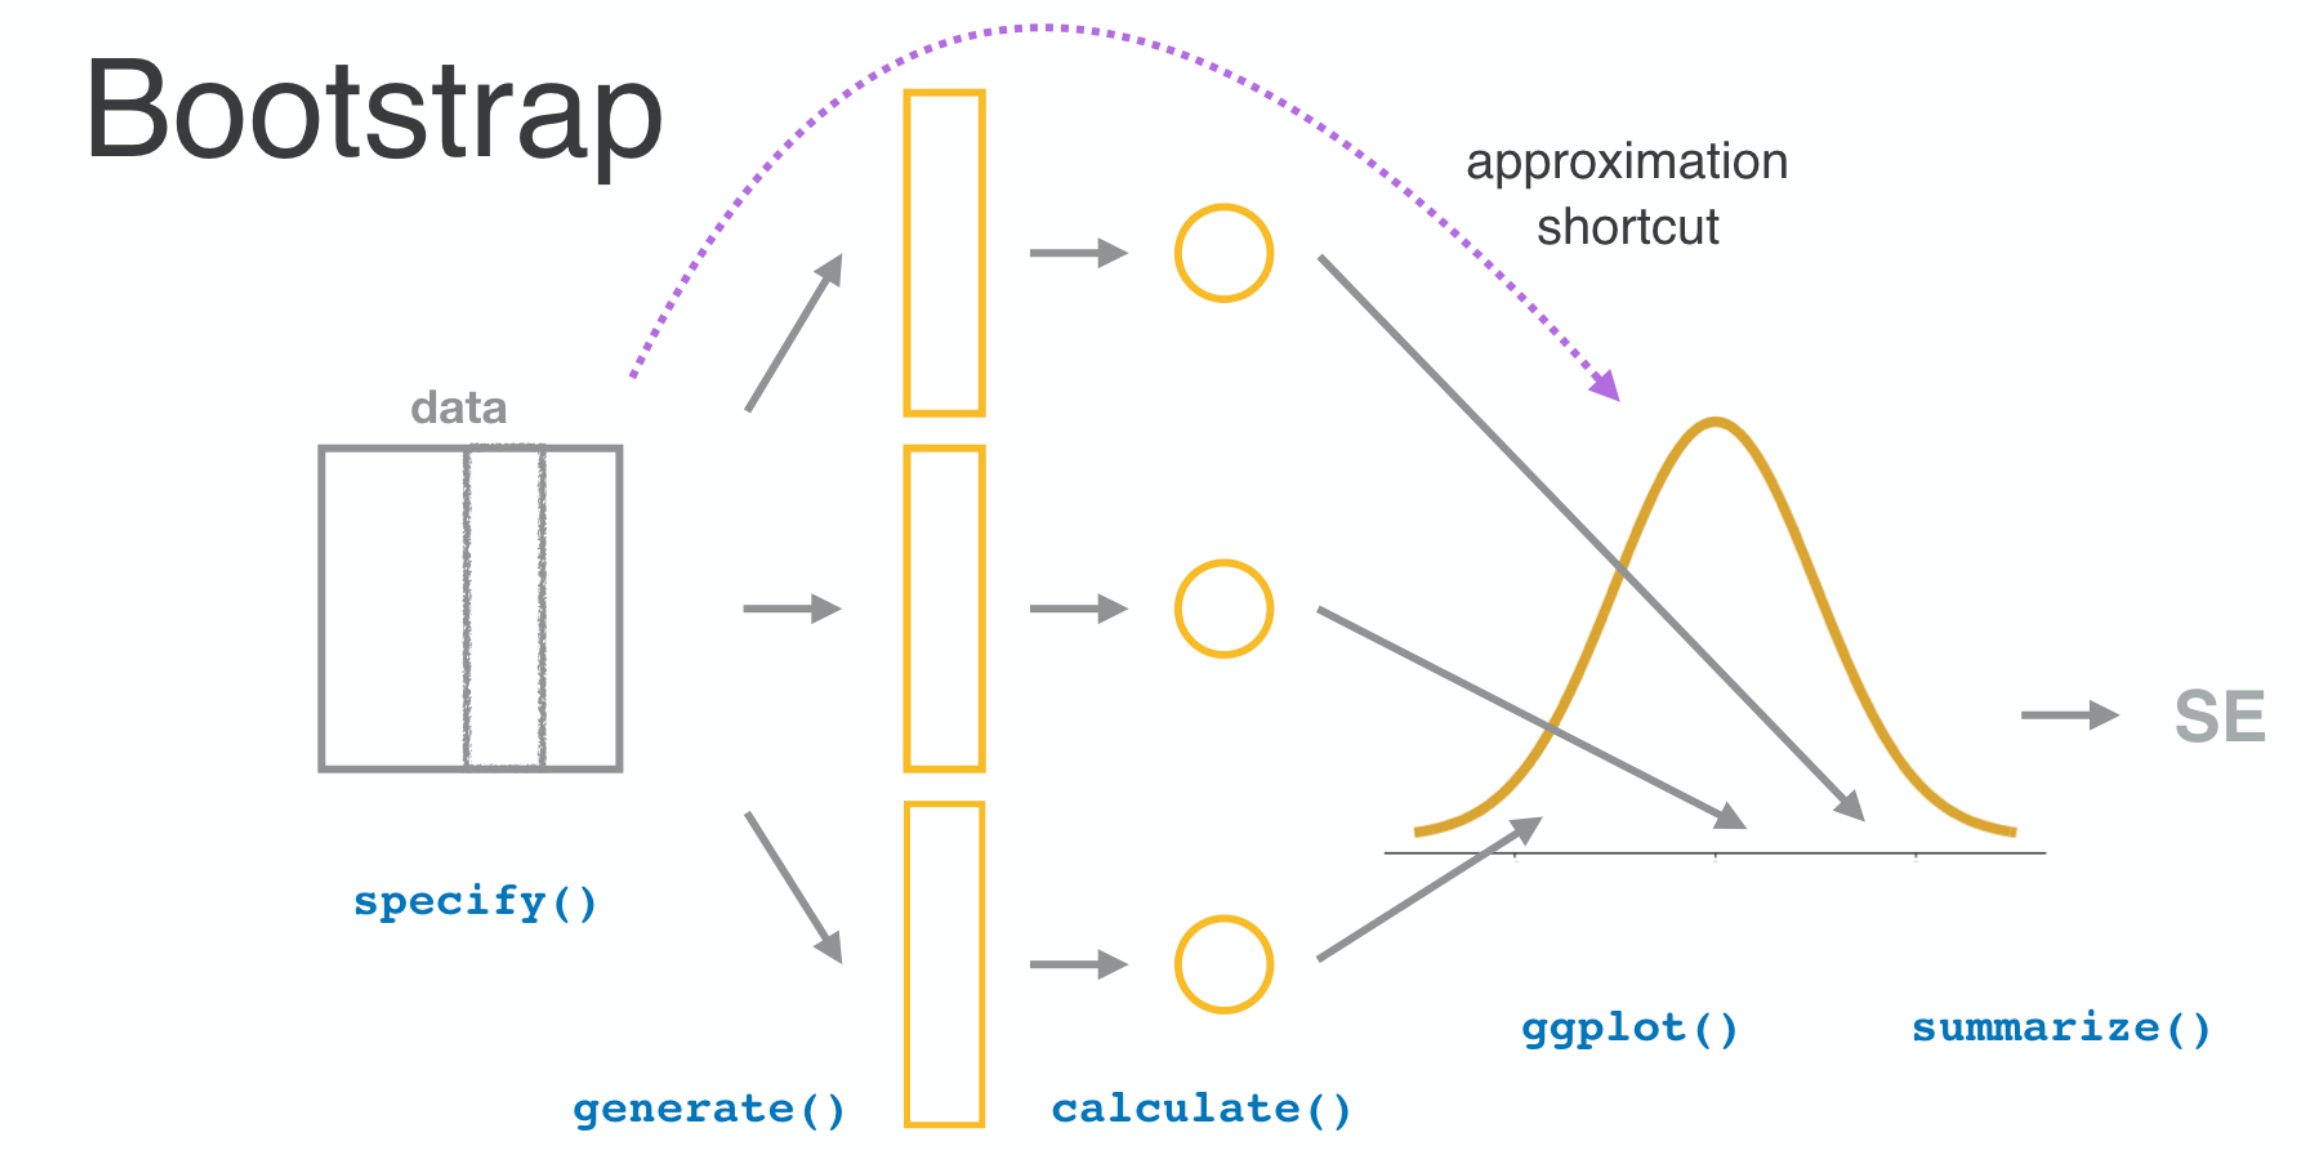
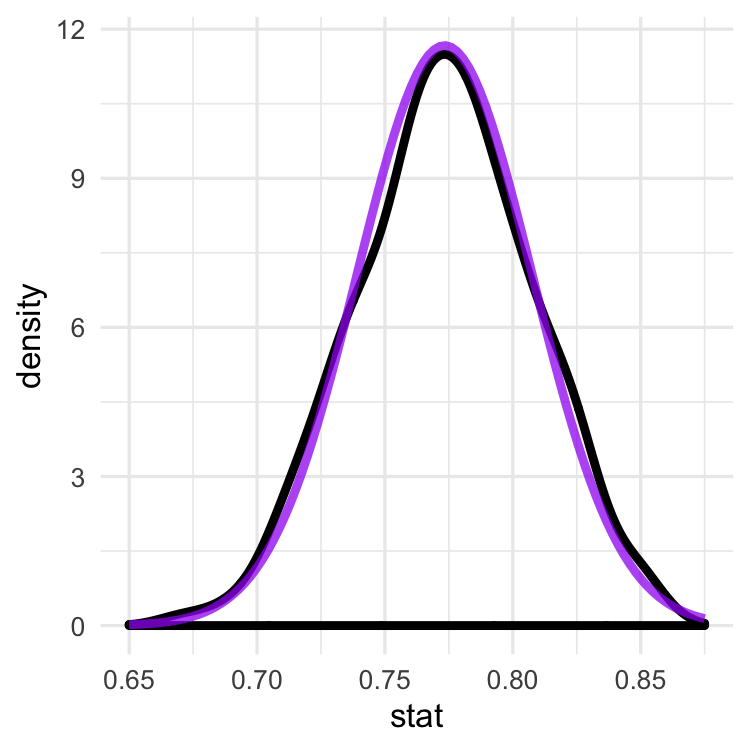
La distribuzione normale
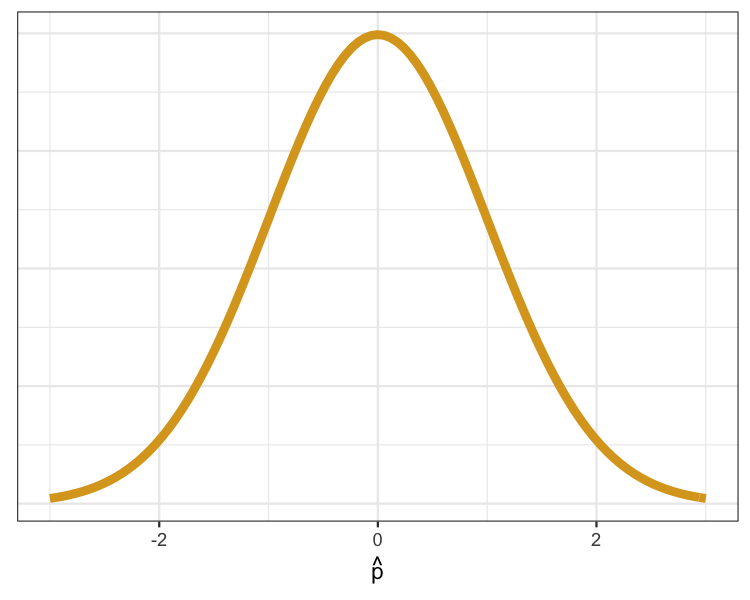
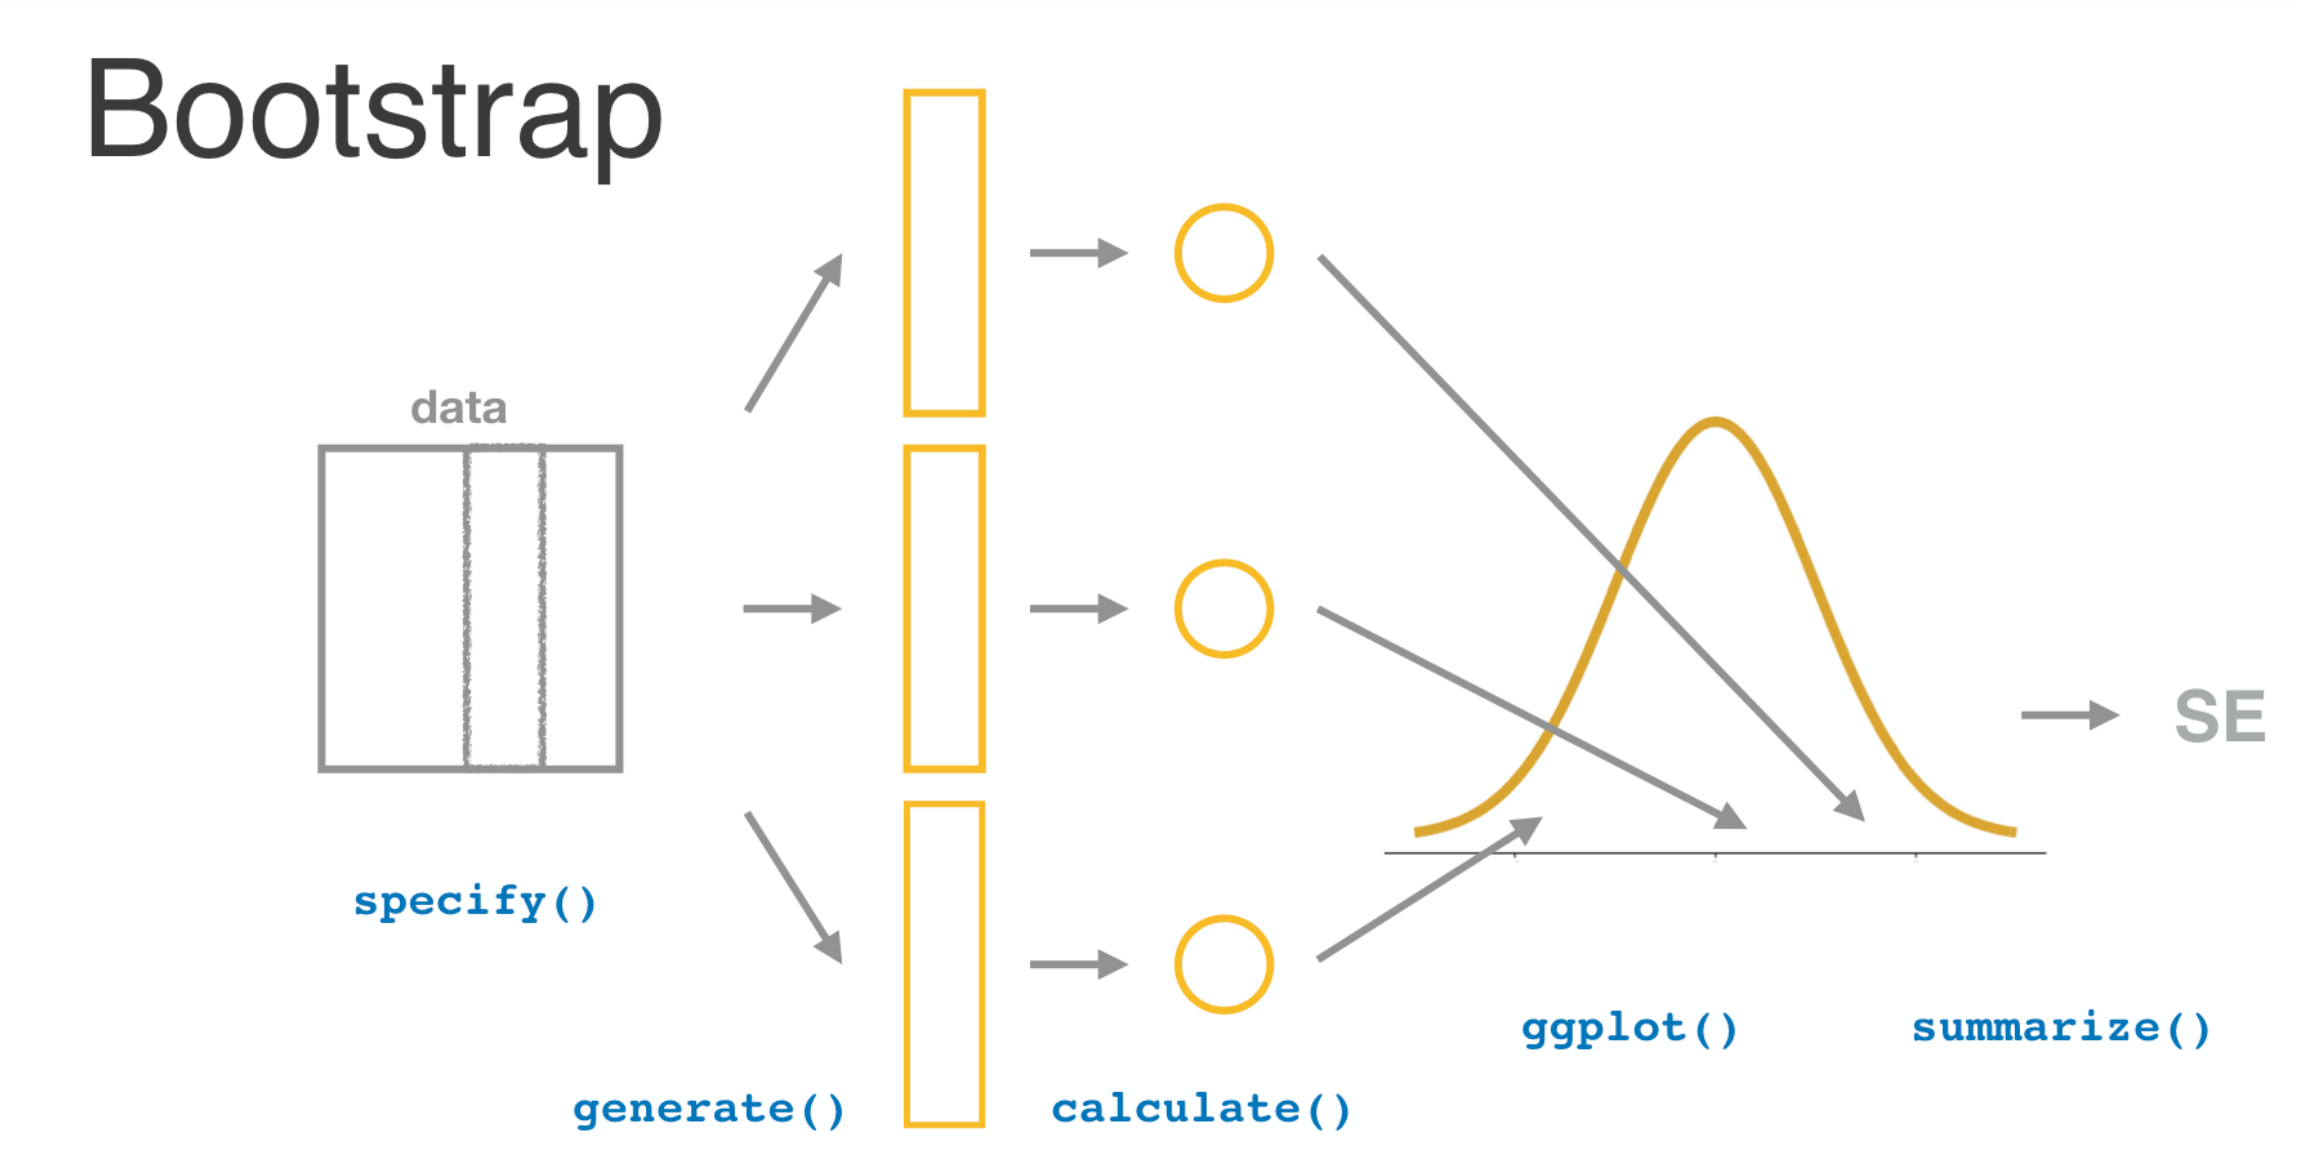
Distribuzioni campionarie
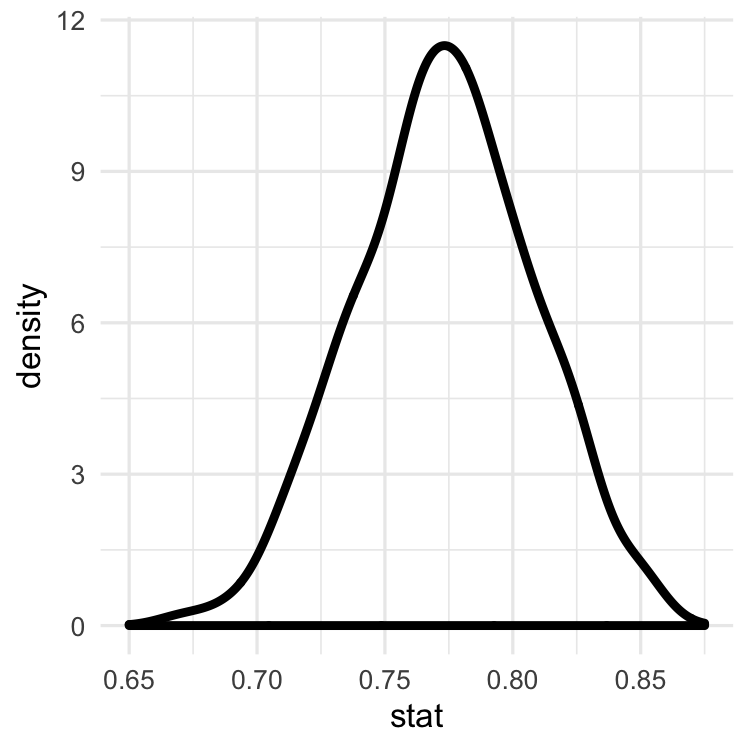
Distribuzioni campionarie
Distribuzioni campionarie
Inferenza per dati categorici in R
Andrew Bray
Assistant Professor of Statistics at Reed College

