Metodo alternativo: distribuzione chi-quadro
Inferenza per dati categorici in R

Andrew Bray
Assistant Professor of Statistics at Reed College
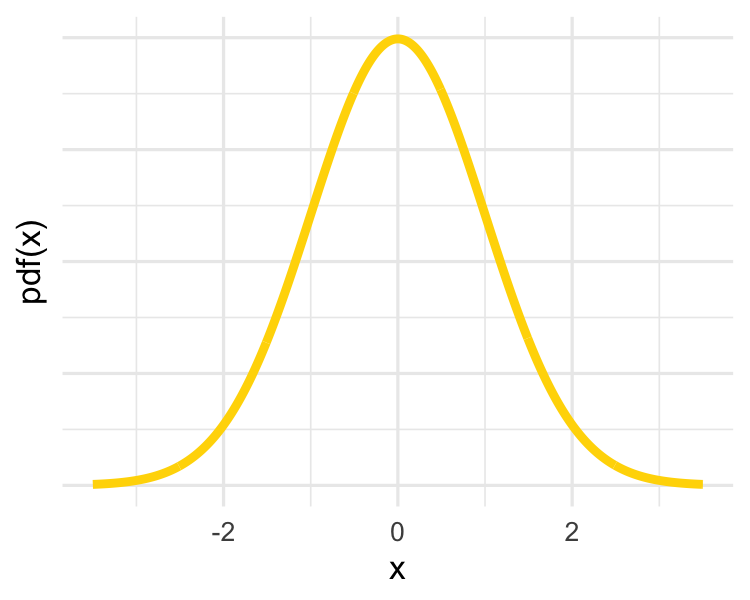
Distribuzioni approssimanti: normale
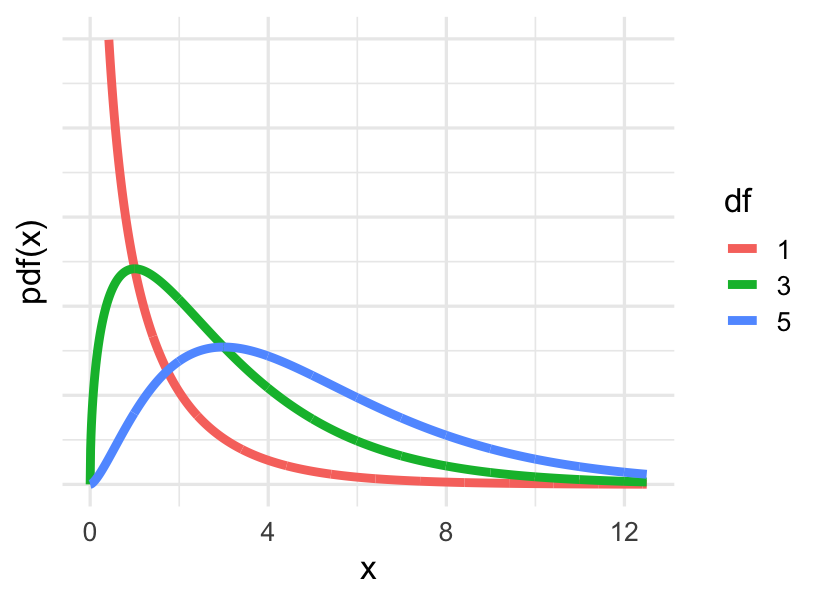
Distribuzioni approssimanti: chi-quadro
Test H con approssimazione
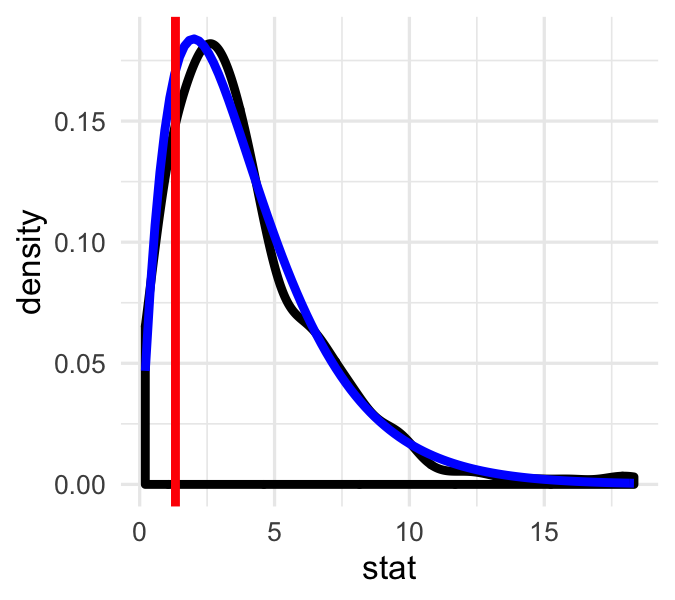
Test H con approssimazione
La distribuzione chi-quadro

