Dalle regole ai grafi

Analisi del carrello in R

Christopher Bruffaerts

Statistician

Visualizzare le regole

Regole interattive

rules_html = plot(rules, method = "graph",
                  engine = "htmlwidget")
rules_html

Salva l'HTML widget

library(htmlwidgets)
saveWidget(rules_html, file = "rules_grocery.html")

regole_grafo

Analisi del carrello in R

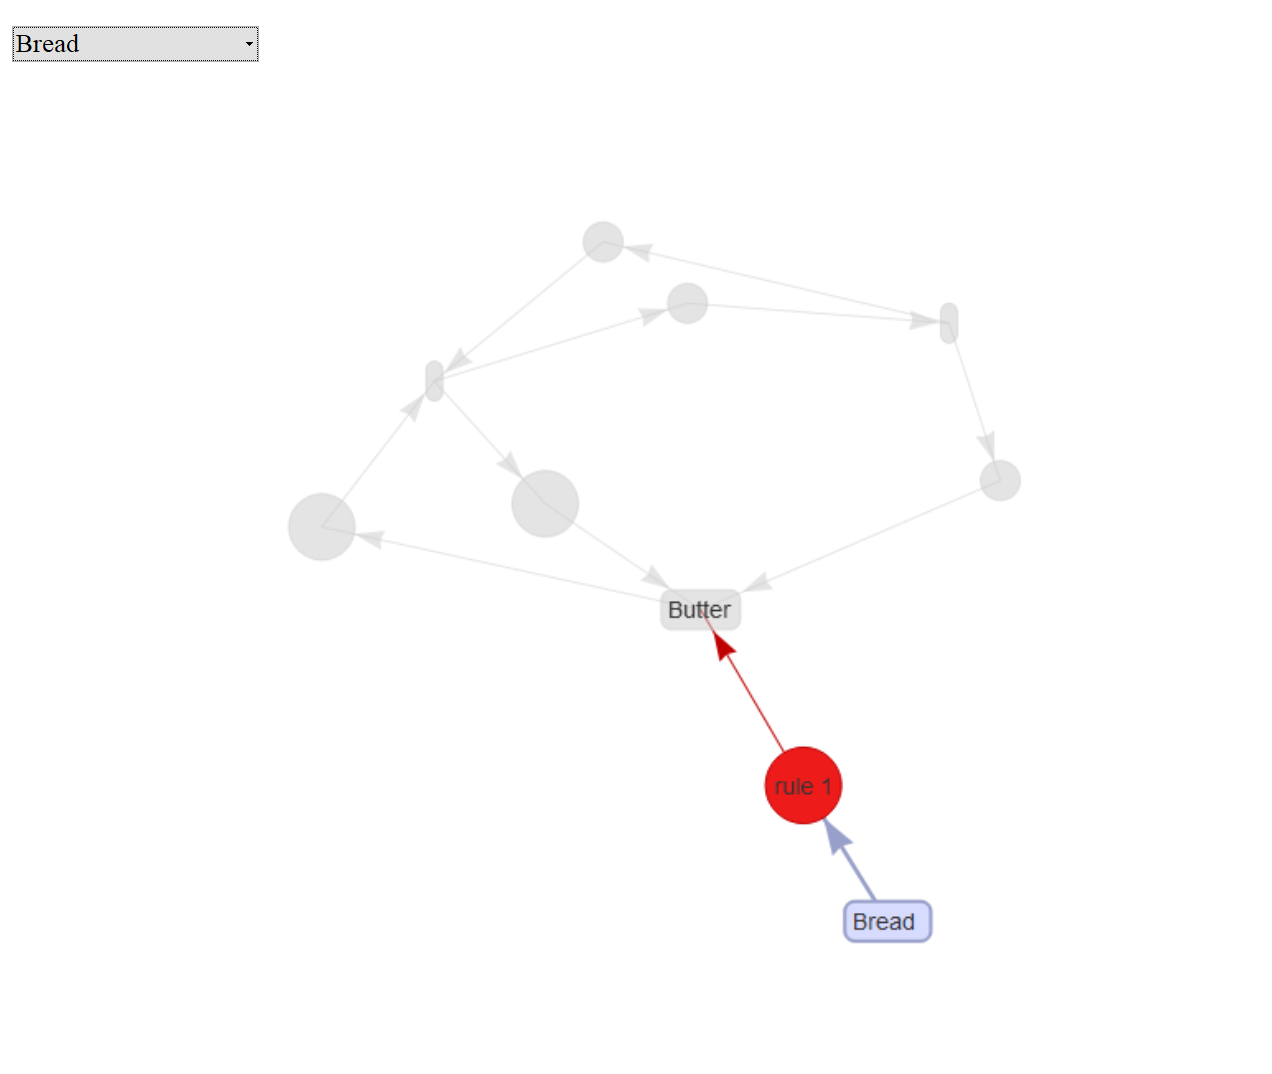
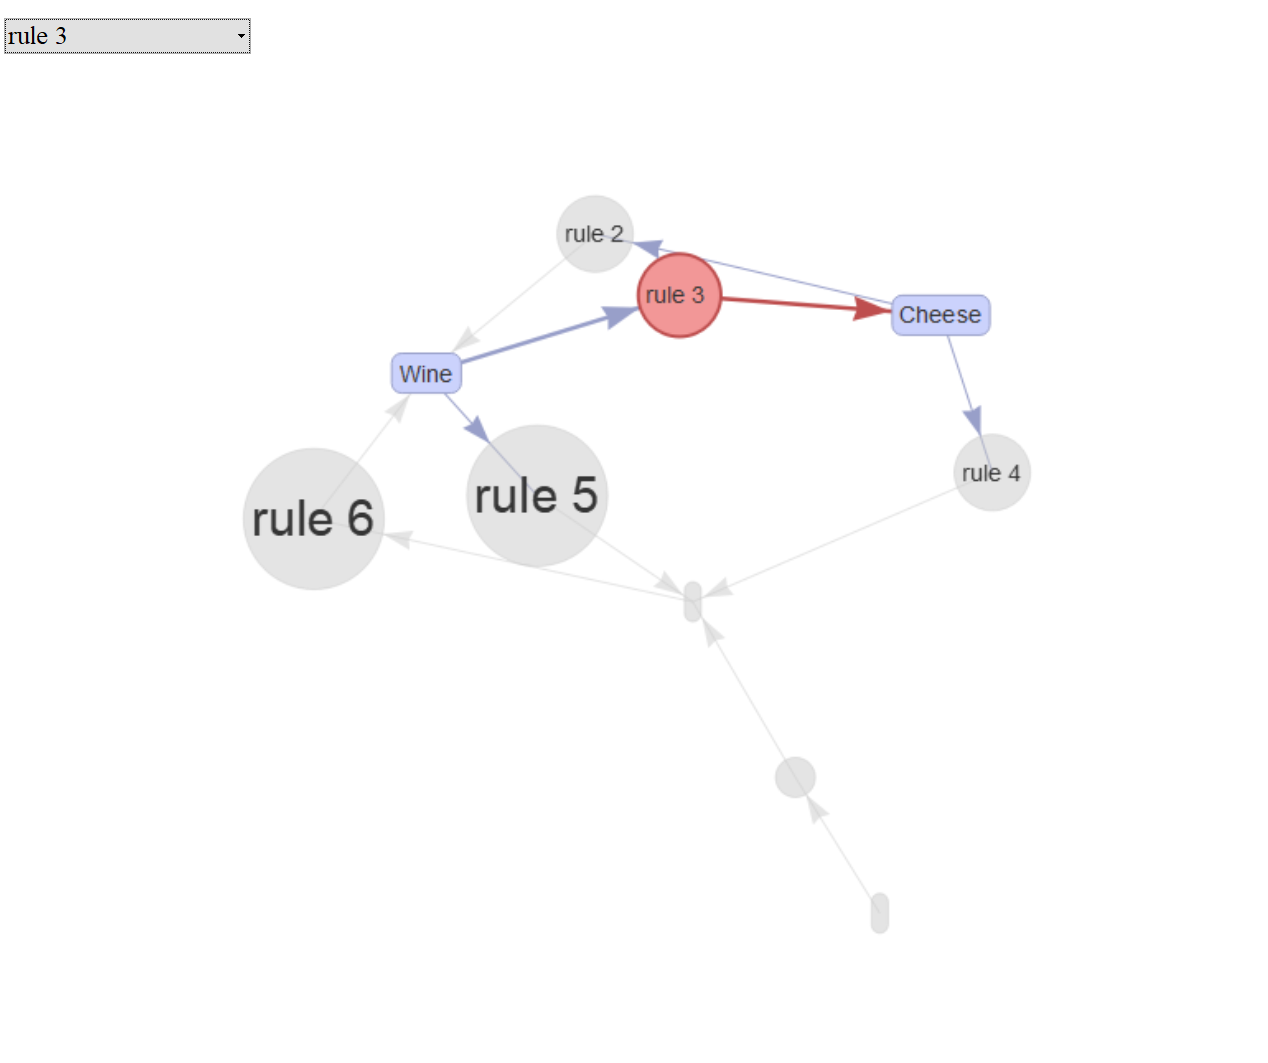
Selezionare item e regole dal grafo

Seleziona l'item Bread

grafo_regola_bread

Seleziona la Regola 3

grafo_regola3

Analisi del carrello in R

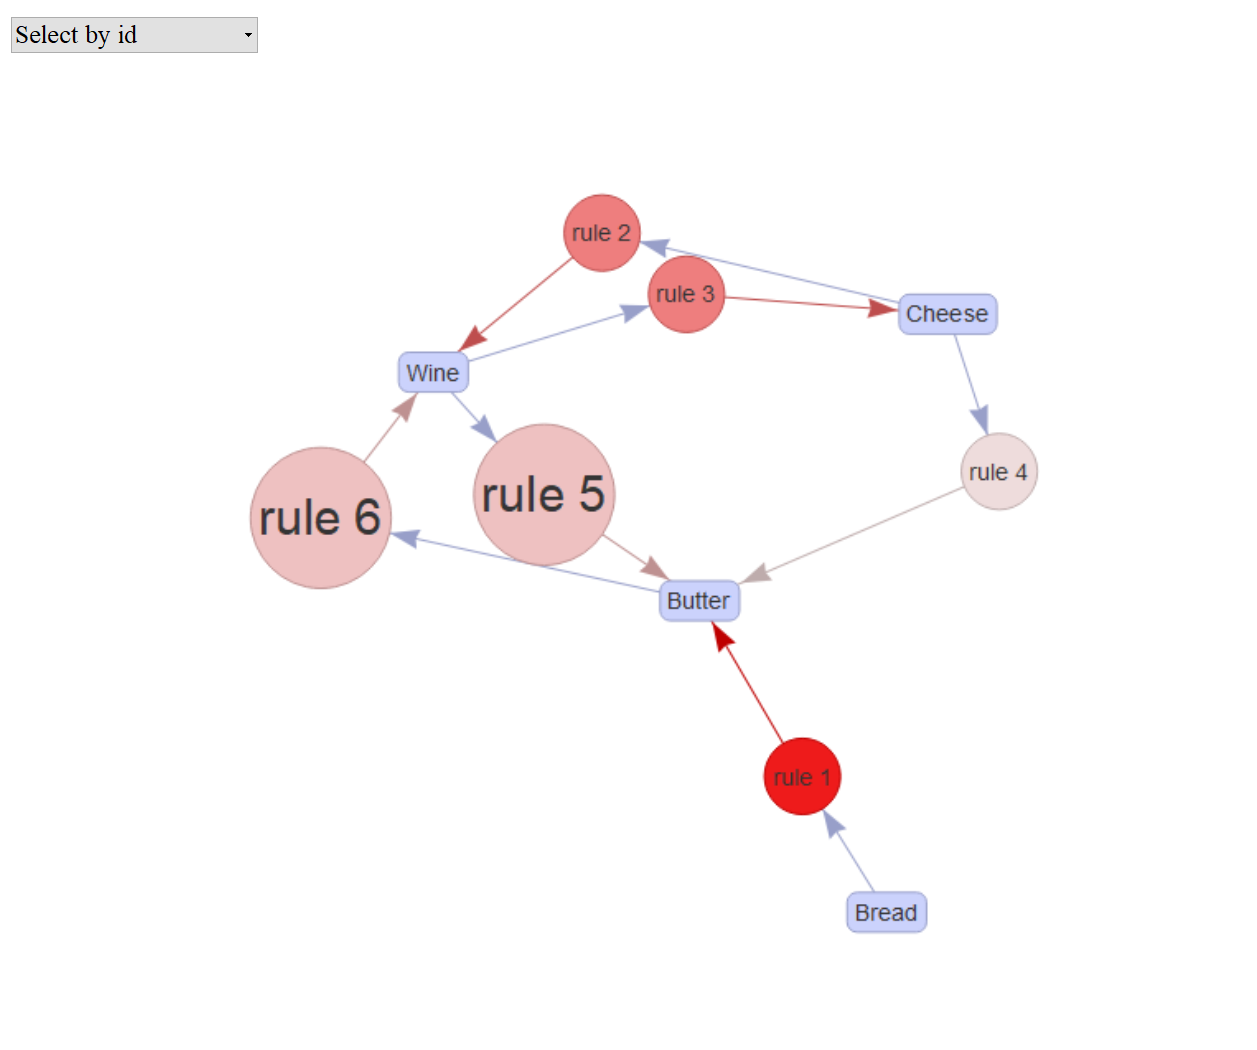
Grafi e sottografi (1)

Ordina le regole per confidence

top4subRules = 
    head(sort(rules, by = "confidence"), 4)
inspect(top4subRules)
    lhs         rhs      support   confidence lift      count
[1] {Bread}  => {Butter} 0.4285714 1.00       1.1666667 3    
[2] {Wine}   => {Butter} 0.5714286 0.80       0.9333333 4    
[3] {Cheese} => {Wine}   0.4285714 0.75       1.0500000 3    
[4] {Cheese} => {Butter} 0.4285714 0.75       0.8750000 3

Grafica le regole ad alta confidence

plot(top4subRules, method = "graph",  engine = "htmlwidget")

regole_grafo_confidence

Analisi del carrello in R

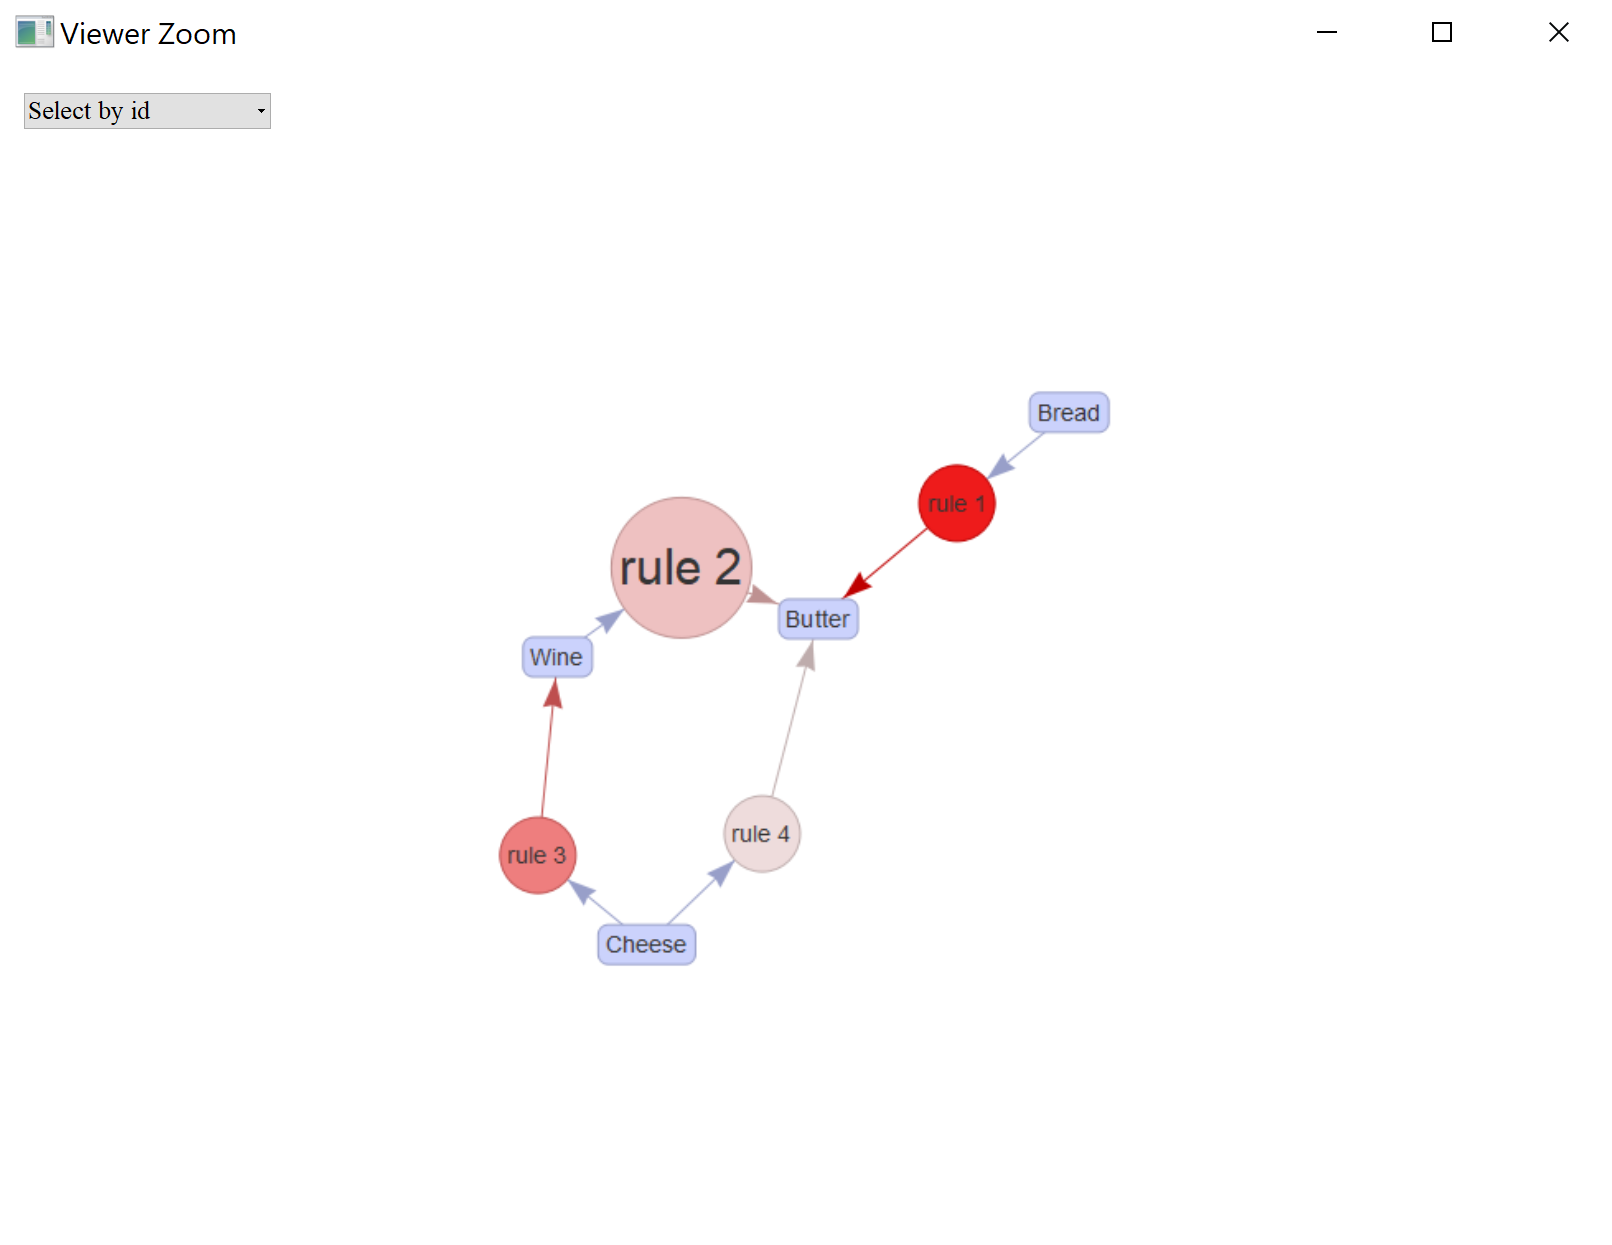
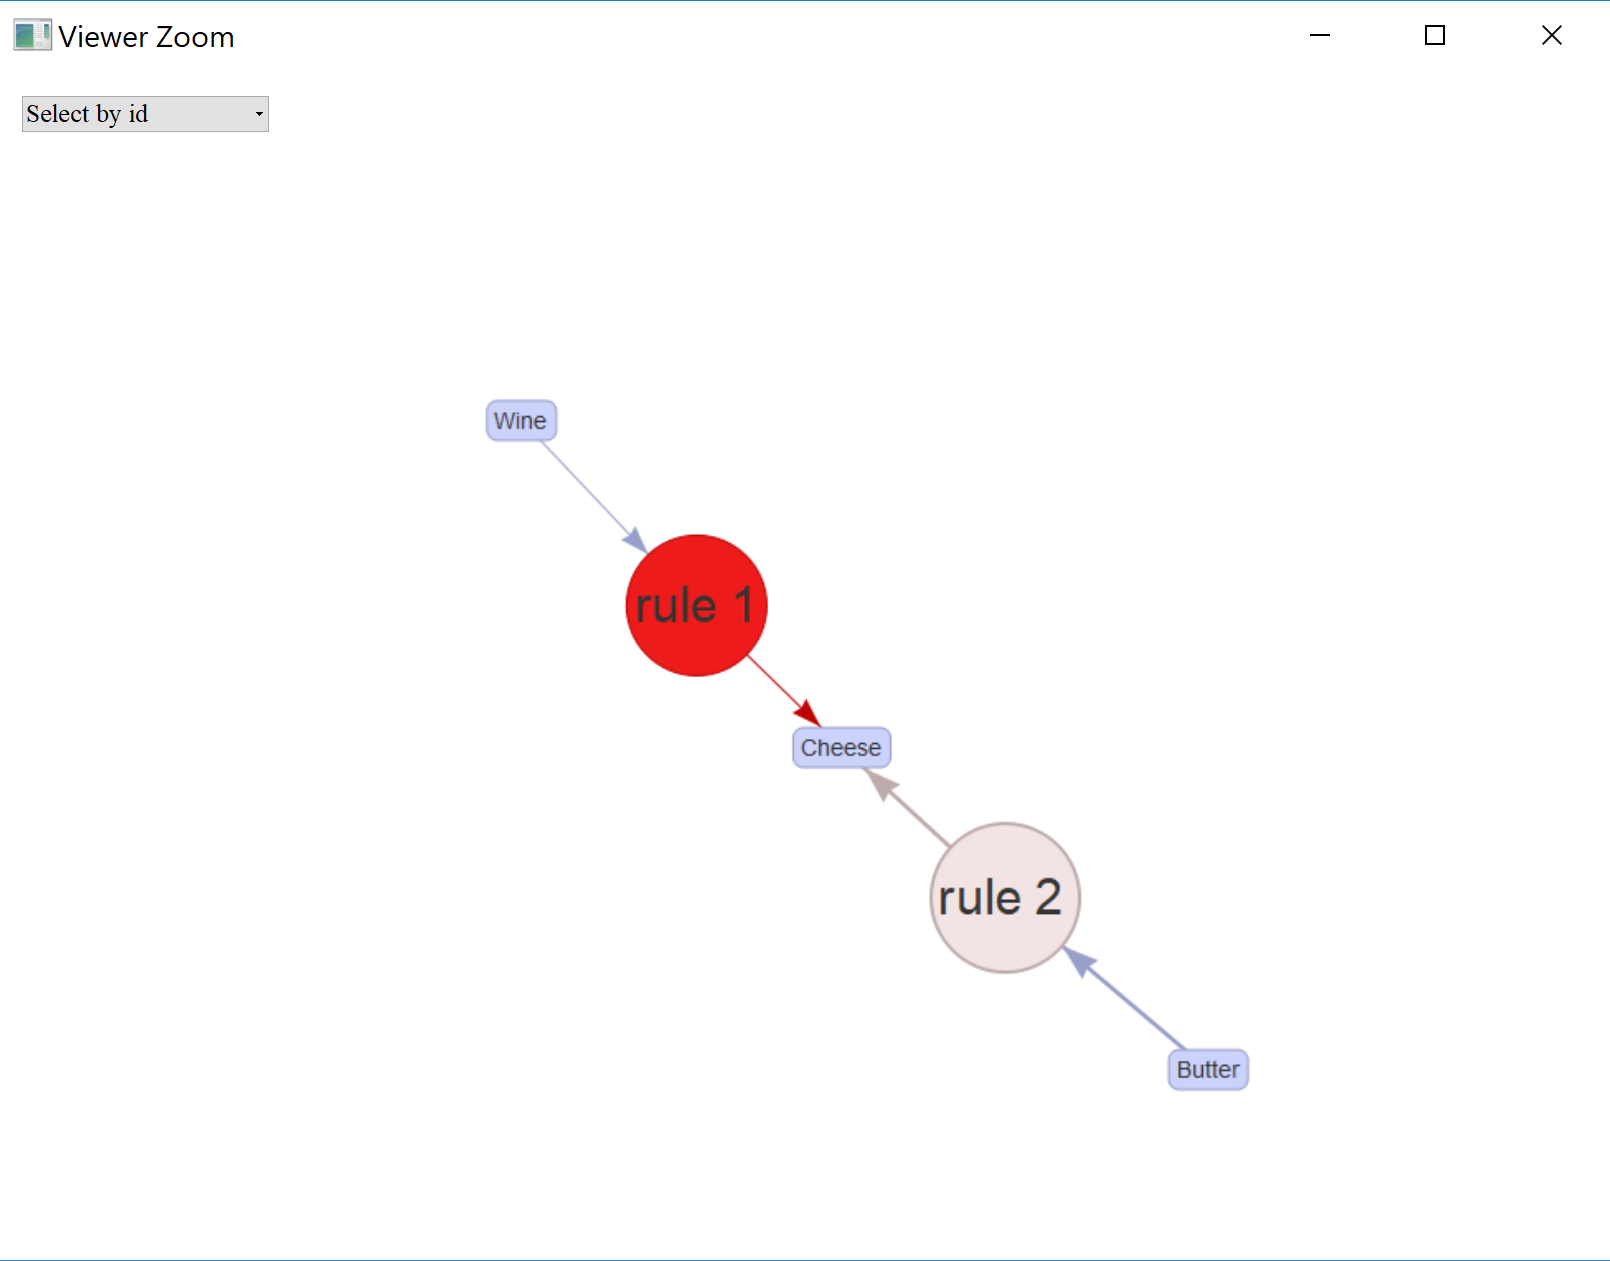
Grafi e sottografi (2)

Ispeziona le regole su Cheese

C_rules = 
    apriori(data = data_trx, 
            parameter = list(supp = 3/7,
                             conf = 0.2,
                             minlen = 2),
            appearance = list(rhs = "Cheese"))
inspect(C_rules)
    lhs         rhs      support   confidence lift  count
[1] {Wine}   => {Cheese} 0.4285714 0.6        1.050 3    
[2] {Butter} => {Cheese} 0.4285714 0.5        0.875 3

Grafica le regole su Cheese

plot(C_rules, method = "graph",  engine = "htmlwidget")

regole_grafo_cheese

Analisi del carrello in R

Salva come Graph

Salva il grafo

saveAsGraph(rules, file = "rules.graphml")
Analisi del carrello in R

Let's rule!

Analisi del carrello in R

Preparing Video For Download...