Introduzione al market basket
Analisi del carrello in R

Christopher Bruffaerts
Statistician
Panoramica
Corso Market Basket
- Capitolo 1: Introduzione alla market basket analysis
- Capitolo 2: Metriche e tecniche nella market basket analysis
- Capitolo 3: Visualizzazione nella market basket analysis
- Capitolo 4: Caso di studio: consigli di film su MovieLens
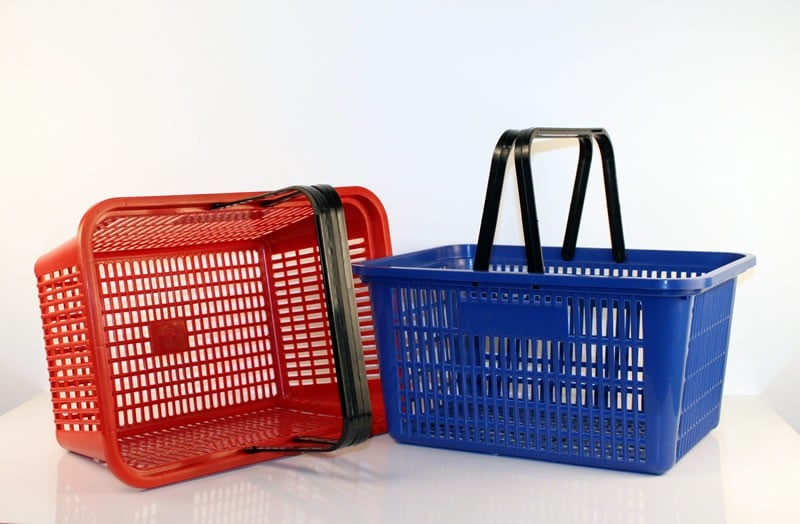
Cos’è un carrello?
Carrello = insieme di articoli
Articoli
- Prodotti al supermercato
- Prodotti su siti online
- Corsi DataCamp
- Film visti dagli utenti
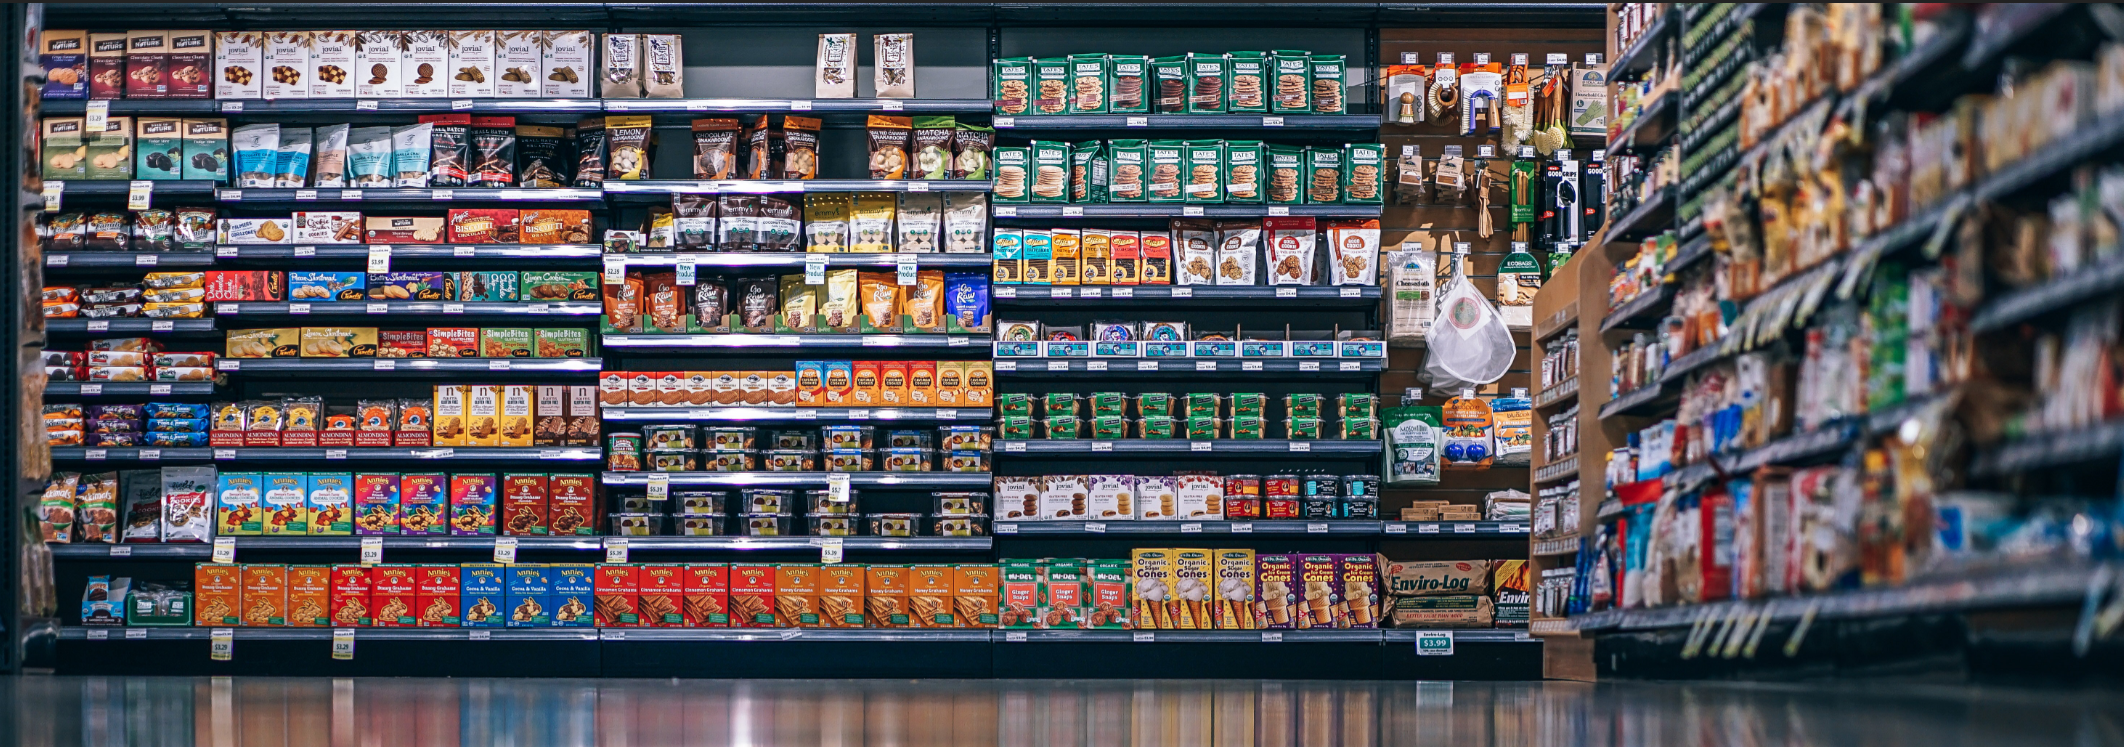
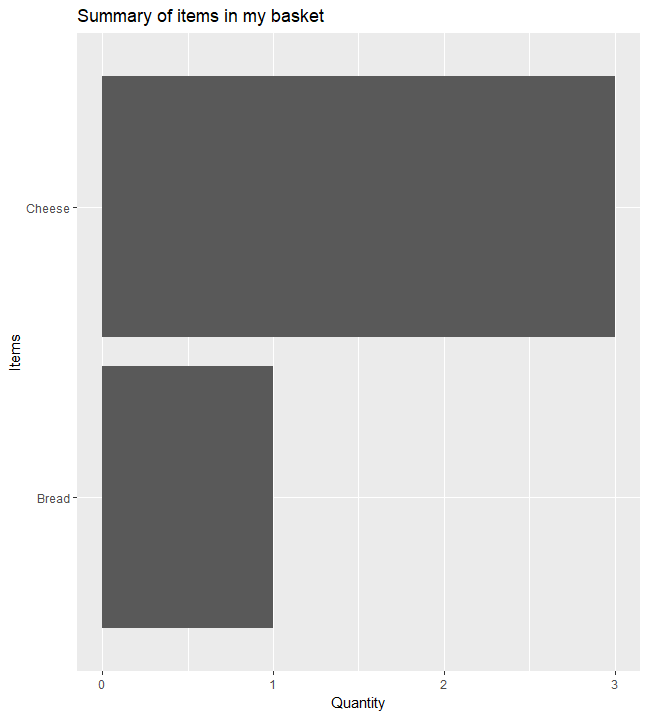
Esempio supermercato
Cosa c’è in negozio?
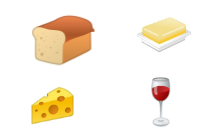
Cosa prendi oggi?
- Un pane
- Tre pezzi di formaggio
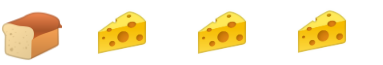
Visualizzare gli articoli nel carrello
Perché guardiamo il mio carrello?
Domanda: C’è relazione tra gli articoli nello stesso carrello?
Torniamo agli esempi
Il tuo carrello al supermercato, e.g. Spaghetti e salsa di pomodoro
Il tuo carrello Amazon, e.g. Telefono e cover
I tuoi corsi su DataCamp e.g. "Introduction to R" e "Intermediate R"

