Componenti principali in un'analisi di regressione
Machine Learning per il Marketing Analytics in R

Verena Pflieger
Data Scientist at INWT Statistics
PC nell'analisi di regressione I
mod1 <- lm(customerSatis ~ ., dataCustomers)library(car) vif(mod1)
      nOrders       nItemsOrdered          nItemsSold        salesOrdered
    29.482287           24.437448           10.390998            5.134720
    salesSold         returnRatio       shareOwnBrand           shareSale
     9.685617           23.778800            1.571607            1.178773
 shareVoucher          crDuration monetaryReturnRatio  meanDaysBetwOrders
     1.213011            1.757509           10.632243            1.698369
salesPerOrder        salesPerItem       itemsPerOrder   itemsSoldPerOrder
     6.563474            4.557981            4.821610           15.949072
# Create dataframe with customer satisfaction and first 6 components
dataCustComponents <- cbind(dataCustomers[, "customerSatis"],
                            pcaCust$x[,1:6]) %>%
  as.data.frame
mod2 <- lm(customerSatis ~ ., dataCustComponents)
vif(mod2)
PC1 PC2 PC3 PC4 PC5 PC6
  1   1   1   1   1   1
summary(mod1)$adj.r.squared
0.8678583
summary(mod2)$adj.r.squared
0.7123822
summary(mod2)
Call:
lm(formula = customerSatis ~ ., data = dataCustComponents)
Residuals:
    Min      1Q  Median      3Q     Max
-3.9279 -0.2411  0.0179  0.2865  1.4972
Coefficients:
             Estimate Std. Error t value Pr(>|t|)
(Intercept)  2.985945   0.014039 212.682  < 2e-16 ***
PC1         -0.175434   0.006704 -26.167  < 2e-16 ***
PC2          0.296659   0.007643  38.815  < 2e-16 ***
PC3         -0.012816   0.010838  -1.182    0.237
PC4         -0.116651   0.011665 -10.000  < 2e-16 ***
PC5          0.101963   0.012508   8.152 1.09e-15 ***
PC6          0.126677   0.013072   9.691  < 2e-16 ***
- - -
Signif. codes:  0 '***' 0.001 '**' 0.01 '*' 0.05 '.' 0.1 ' ' 1
Residual standard error: 0.4415 on 982 degrees of freedom
Multiple R-squared:  0.7141,    Adjusted R-squared:  0.7124
F-statistic: 408.9 on 6 and 982 DF,  p-value: < 2.2e-16
| Cosa impari sulla PCA | |
|---|---|
| Hai imparato... | a ridurre il numero di variabili senza perdere troppa informazione |
| che le variabili vanno standardizzate prima di una PCA | |
| come decidere il numero di componenti rilevanti | |
| a interpretare le componenti selezionate |
| Cosa impari dal modello | |
|---|---|
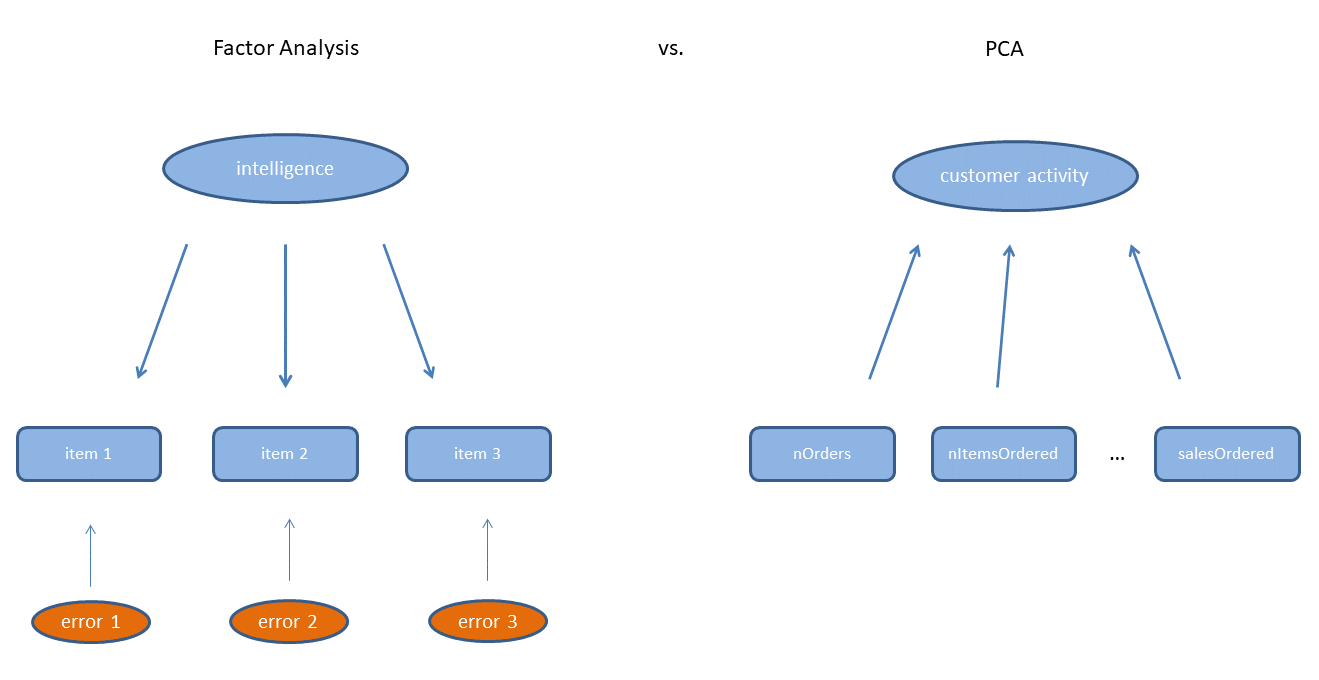
| Hai imparato... | che le variabili originali si possono ridurre a 6 componenti, p.es. attività cliente, comportamento di reso e brand awareness |
| che usare le prime sei componenti per spiegare la soddisfazione del cliente riduce la varianza spiegata, ma risolve il problema della multicollinearità |
Esercitiamoci!
Machine Learning per il Marketing Analytics in R

