Validazione out-of-sample e cross validation
Machine Learning per il Marketing Analytics in R

Verena Pflieger
Data Scientist at INWT Statistics
Out-of-sample fit: training e test
1) Dividi l'insieme di dati in training e test
# Generating random index for training and test set
# set.seed ensures reproducibility of random components
set.seed(534381)

churnData$isTrain <- rbinom(nrow(churnData), 1, 0.66)
train <- subset(churnData, churnData$isTrain == 1)
test <- subset(churnData, churnData$isTrain == 0)
Out-of-sample fit: costruzione del modello
2) Crea un modello sui dati di training
# Modeling logitTrainNew
logitTrainNew <- glm( returnCustomer ~ title + newsletter +
                     websiteDesign + paymentMethod + couponDiscount +
                     purchaseValue + throughAffiliate +
                     shippingFees + dvd + blueray + vinyl +
                     videogameDownload + prodOthers + prodRemitted,
                     family = binomial, data = train)

# Predizione out-of-sample per logitTrainNew
test$predNew <- predict(logitTrainNew, type = "response",
                        newdata = test)
Accuratezza out-of-sample
# Calculating the confusion matrix
confMatrixNew <- confusion.matrix(test$returnCustomer, test$predNew,
                 threshold = 0.3)
confMatrixNew

# Calculating the accuracy
accuracyNew <- sum(diag(confMatrixNew)) / sum(confMatrixNew)
accuracyNew
    obs
pred     0    1
   0 11939 2449
   1   716  350

0.7951987
Cross-validation: setup
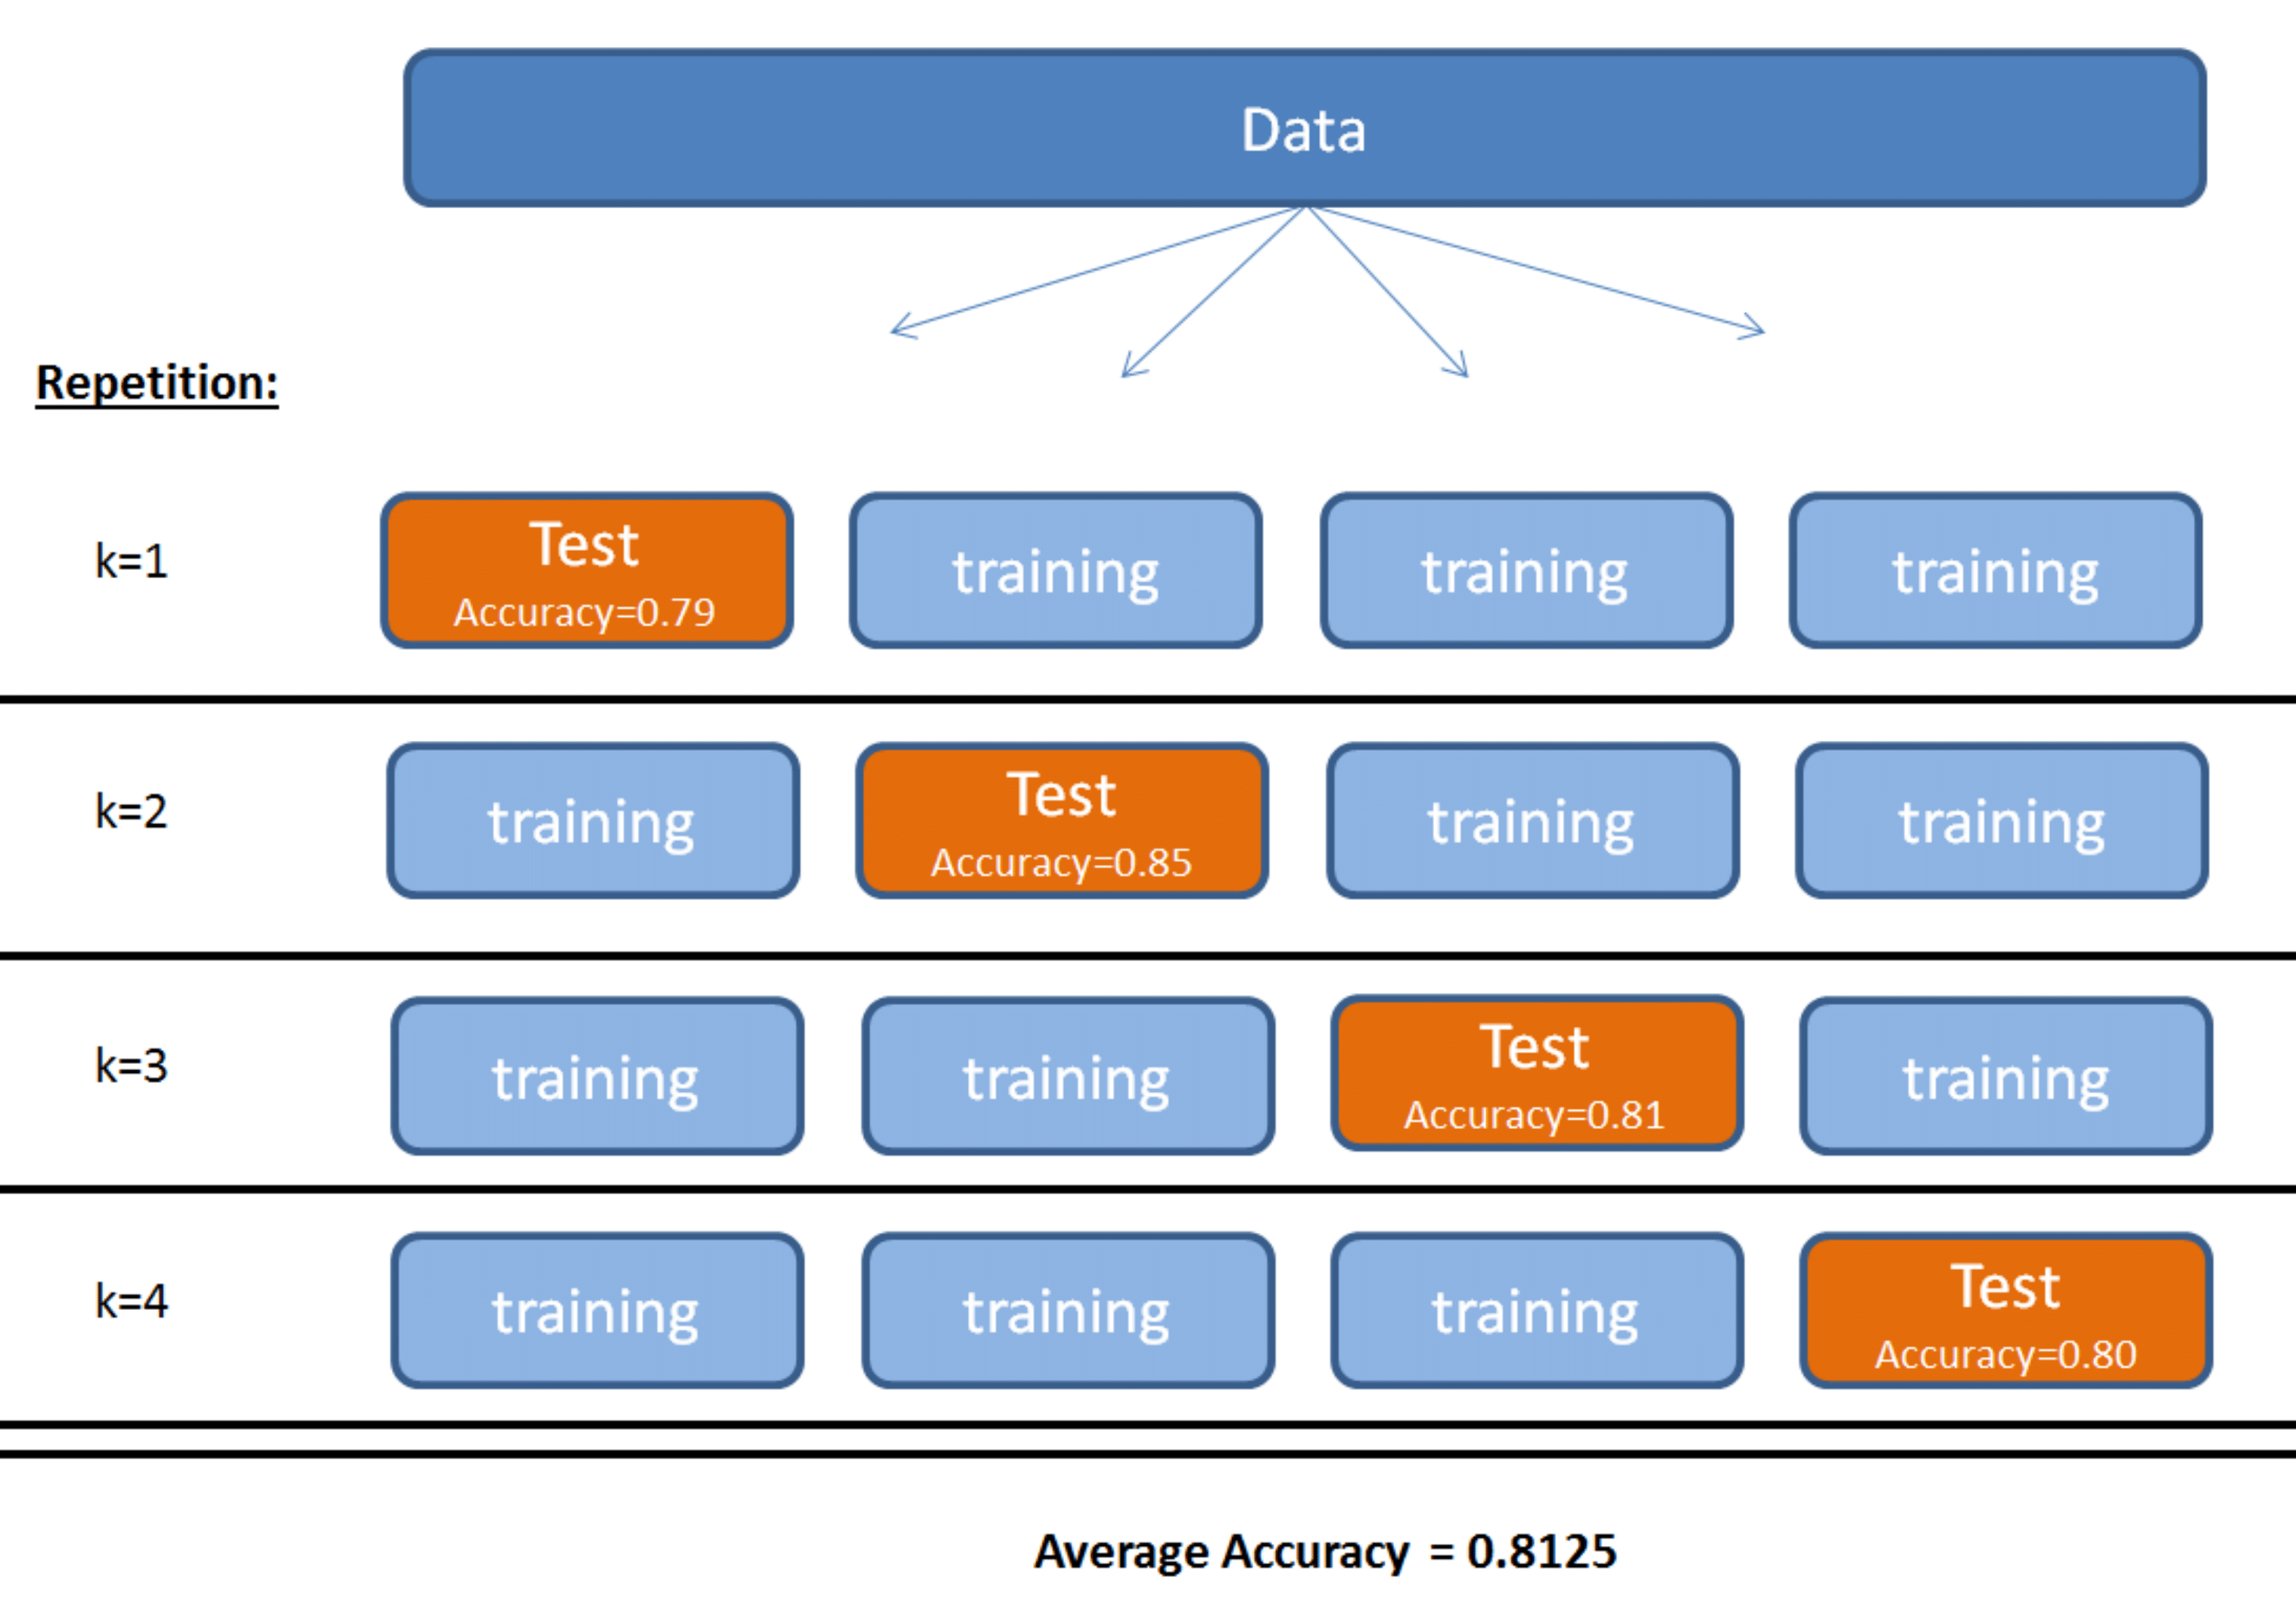
Cross-validation: accuratezza
Calcolo dell'accuratezza con cross-validation
library(boot)
# Accuracy function with threshold = 0.3
Acc03 <- function(r, pi = 0) {
  cm <- confusion.matrix(r, pi, threshold = 0.3)
  acc <- sum(diag(cm)) / sum(cm)
  return(acc)}
# Accuracy
set.seed(534381)
cv.glm(churnData, logitModelNew, cost = Acc03, K = 6)$delta
0.7943894
| Cosa hai imparato: Logistic Regression | |
|---|---|
| Hai imparato... | a prevedere quali clienti di un e-commerce potrebbero abbandonare |
| a usare una regressione logistica binaria per calcolare probabilità | |
| che la scelta della soglia è cruciale |
| Cosa emerge dal modello | |
|---|---|
| Hai imparato... | che chi si iscrive alla newsletter ha più probabilità di tornare |
| che chi usa un coupon ha meno probabilità di tornare | |
| che chi non paga le spese di spedizione ha più probabilità di tornare | |
| ecc. |
Ultimo esercizio!
Machine Learning per il Marketing Analytics in R

