Scegliere il numero giusto di componenti principali

Machine Learning per il Marketing Analytics in R

Verena Pflieger

Data Scientist at INWT Statistics

N. componenti rilevanti: varianza spiegata

# Proportion of variance explained:
summary(pcaCust)
Importance of components:
                          PC1    PC2    PC3     PC4     PC5     PC6     PC7
Standard deviation     2.0951 1.8379 1.2960 1.20415 1.12301 1.07453 0.80486
Proportion of Variance 0.2743 0.2111 0.1050 0.09062 0.07882 0.07216 0.04049
Cumulative Proportion  0.2743 0.4855 0.5904 0.68106 0.75989 0.83205 0.87254
                           PC8     PC9    PC10    PC11    PC12    PC13
Standard deviation     0.78236 0.72452 0.61302 0.48428 0.36803 0.25901
Proportion of Variance 0.03826 0.03281 0.02349 0.01466 0.00847 0.00419
Cumulative Proportion  0.91079 0.94360 0.96709 0.98175 0.99021 0.99440
                          PC14    PC15    PC16
Standard deviation     0.20699 0.17126 0.13170
Proportion of Variance 0.00268 0.00183 0.00108
Cumulative Proportion  0.99708 0.99892 1.00000
Machine Learning per il Marketing Analytics in R

N. componenti rilevanti: criterio di Kaiser-Guttman

Criterio di Kaiser-Guttman: autovalore > 1

pcaCust$sdev ^ 2
 [1] 4.38961593 3.37778445 1.67965616 1.44997580 1.26115351 1.15461579
 [7] 0.64780486 0.61209376 0.52492468 0.37579685 0.23452736 0.13544710
[13] 0.06708362 0.04284504 0.02933027 0.01734481
Machine Learning per il Marketing Analytics in R

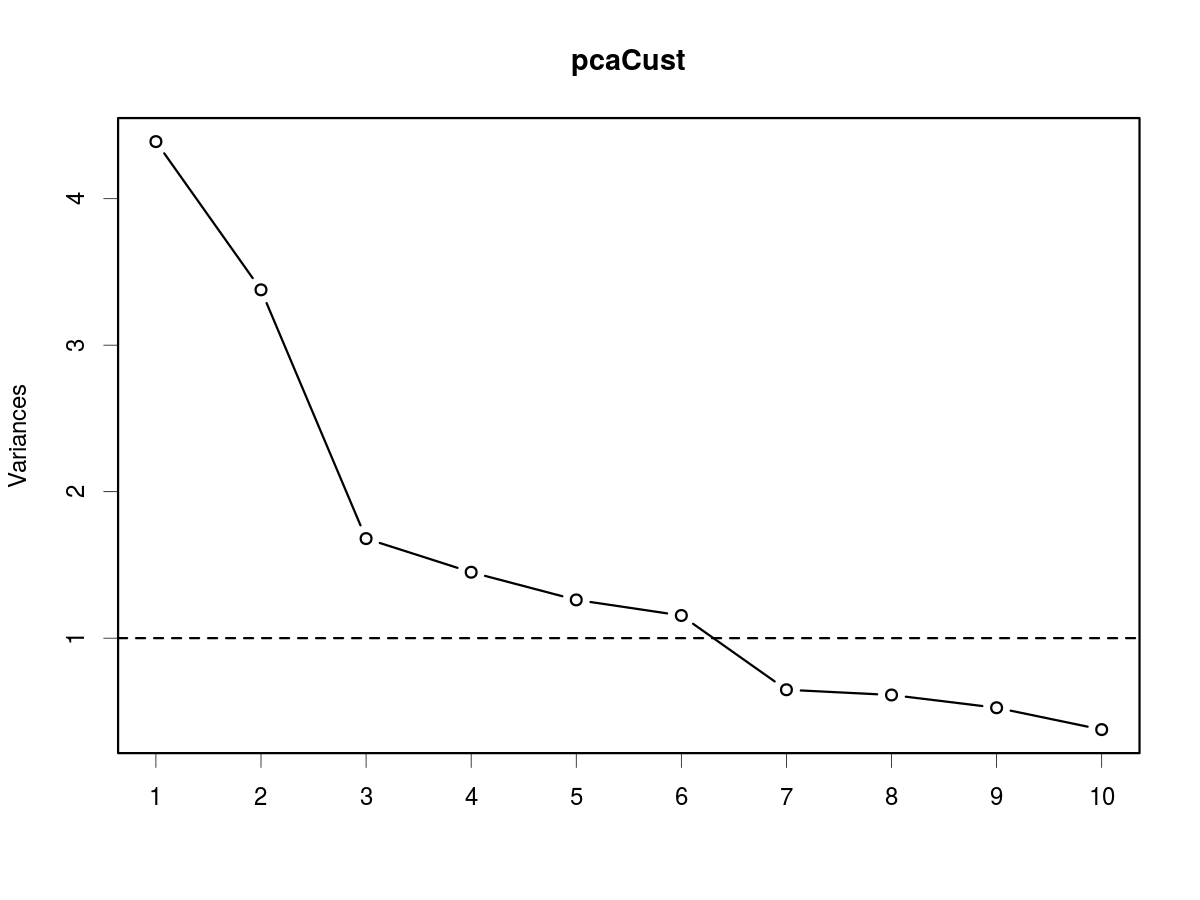
N. componenti rilevanti: screeplot

Lo screeplot ovvero: «Trova il gomito»

screeplot(pcaCust, type = "lines")
box()
abline(h = 1, lty = 2)

Machine Learning per il Marketing Analytics in R

Numero di componenti suggerito per criterio

Varianza spiegata Kaiser-Guttman Screeplot
5 6 6
Machine Learning per il Marketing Analytics in R

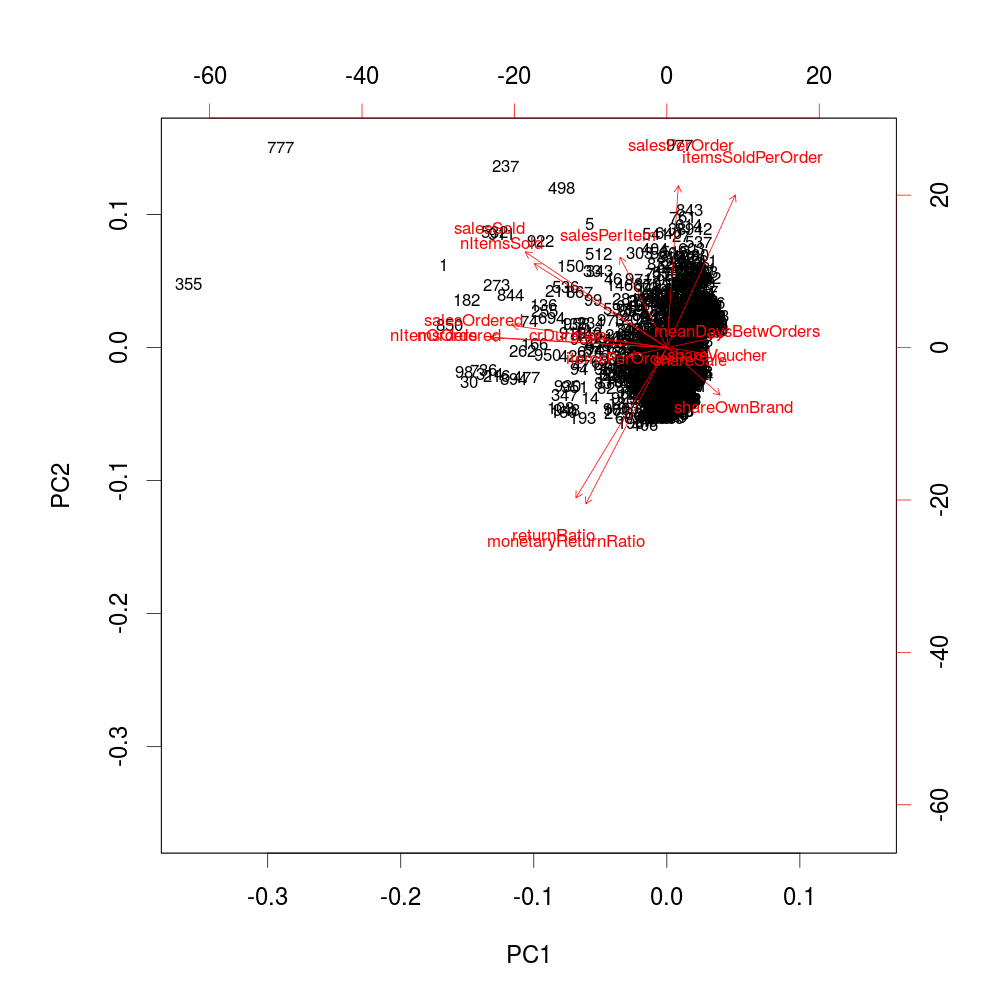
Il biplot

biplot(pcaCust, choices = 1:2, cex = 0.7)

Machine Learning per il Marketing Analytics in R

Esercitiamoci!

Machine Learning per il Marketing Analytics in R

Preparing Video For Download...