Un ottimo twist con ggplot

Programmare con dplyr

Dr. Chester Ismay

Educator, Data Scientist, and R/Python Consultant
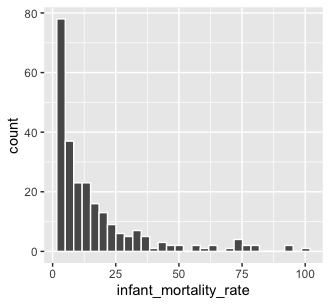
Basi di ggplot2

library(ggplot2)
ggplot(
    world_bank_data, 
    aes(x = infant_mortality_rate)
) +

geom_histogram(color = "white")

Istogramma di infant_mortality_rate

Programmare con dplyr

Aggiungere un titolo

ggplot(
    world_bank_data, 
    aes(x = infant_mortality_rate)
) + 
  geom_histogram(color = "white") +

ggtitle("A histogram of infant_mortality_rate")

ggplot2 con titolo

Programmare con dplyr

Racchiudere in una funzione

# Codice del grafico precedente
ggplot(world_bank_data, aes(x = infant_mortality_rate)) + 
  geom_histogram(color = "white") +
  ggtitle("A histogram of infant_mortality_rate")
# Definisci una funzione
my_histogram <- function(

df, x_var) {
ggplot(df, aes(x = x_var)) + geom_histogram(color = "white") + ggtitle(paste("A histogram of", x_var)) }
Programmare con dplyr

Miglioriamo la funzione

# Primo tentativo di funzione
my_histogram <- function(df, x_var) {
  ggplot(df, aes(x = x_var)) +
    geom_histogram(color = "white") +
    ggtitle(paste("A histogram of", x_var))
}

# Chiama la funzione my_histogram(df = world_bank_data, x_var = infant_mortality_rate)
 Error in paste("A histogram of", x_var) : 
  object 'infant_mortality_rate' not found
Programmare con dplyr

Aggiungiamo rlang

# Primo tentativo di funzione
my_histogram <- function(df, x_var) {
  ggplot(df, aes(x = x_var)) +
    geom_histogram(color = "white") +
    ggtitle(paste("A histogram of", x_var))
}
# Aggiustamenti per evitare l'errore
my_histogram <- function(df, x_var) {
  ggplot(df, aes(x = {{ x_var }})) +

geom_histogram(color = "white") + ggtitle(paste("A histogram of",
as_label(enquo(x_var))) }
Programmare con dplyr

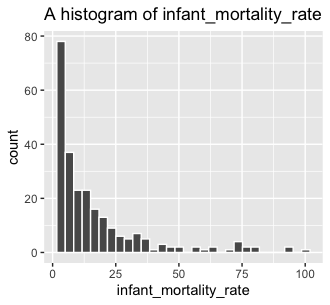
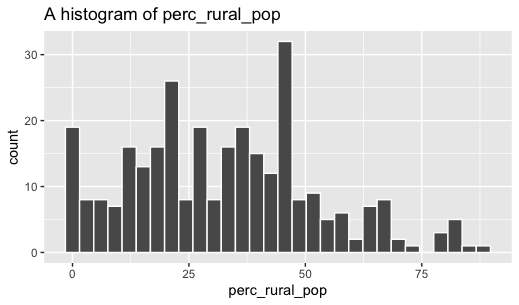
Usare la nostra funzione

# Funzione definita con operatori rlang
my_histogram <- function(df, x_var) {
  ggplot(df, aes(x = {{ x_var }})) +
    geom_histogram(color = "white") +
    ggtitle(paste(
      "A histogram of", 
      as_label(enquo(x_var))
    ))
}

# Chiama la funzione con la pipe! world_bank_data %>% my_histogram(x_var = perc_rural_pop)

Istogramma ggplot2 con rlang

Programmare con dplyr

Passiamo alla pratica !

Programmare con dplyr

Preparing Video For Download...